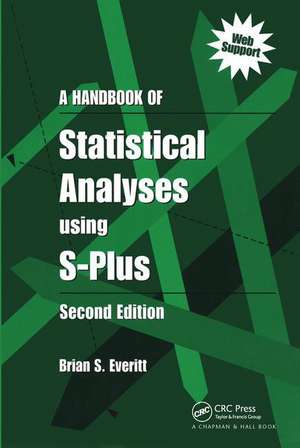
A Handbook of Statistical Analyses Using S-PLUS
Autor Brian S. Everitten Limba Engleză Hardback – 30 sep 2020
This handbook provides the perfect vehicle for introducing the exciting possibilities S-PLUS, S-PLUS 2000, and S-PLUS 6 hold for data analysis. All of the data sets used in the text, along with script files giving the command language used in each chapter, are available for download from the Internet at http://www.iop.kcl.ac.uk/iop/Departments/BioComp/splus.shtml
Preț: 990.09 lei
Preț vechi: 1406.08 lei
-30% Nou
Puncte Express: 1485
Preț estimativ în valută:
189.46€ • 198.72$ • 157.72£
189.46€ • 198.72$ • 157.72£
Carte tipărită la comandă
Livrare economică 01-15 aprilie
Preluare comenzi: 021 569.72.76
Specificații
ISBN-13: 9781138469402
ISBN-10: 1138469408
Pagini: 254
Dimensiuni: 156 x 234 mm
Greutate: 0.63 kg
Ediția:2 New edition
Editura: CRC Press
Colecția Chapman and Hall/CRC
ISBN-10: 1138469408
Pagini: 254
Dimensiuni: 156 x 234 mm
Greutate: 0.63 kg
Ediția:2 New edition
Editura: CRC Press
Colecția Chapman and Hall/CRC
Public țintă
UndergraduateCuprins
Preface -- Distributors for S-PLUS -- 1 An Introduction to S-PLUS -- 1.1 Introduction -- 1.2 Running S-PLUS -- 1.3 The S-PLUS GUI: An Introduction -- 1.4 The S-PLUS Command Language: An Introduction -- 1.4.1 Elementary Commands -- 1.4.2 Vectors and Matrices -- 1.4.3 Sub setting Matrices and Vectors -- 1.4.4 Other S-PLUS Objects -- 1.5 An Example of an S-PLUS Session -- Exercises -- 2 Describing Data and Assessing Distributions: Husbands and Wives -- 2.1 Introduction -- 2.2 Some Basic Summaries -- 2.3 Analysis Using S-PLUS -- 2.4 Exercises -- 3 Analysis of Variance: Poisoning Rats and Losing Weight -- 3.1 Description of Data -- 3.2 Analysis of Variance -- 3.3 Analysis Using S-PLUS -- 3.3.1 Analysis of Variance of Survival Times of Rats -- 3.3 2 Analysis of Variance of Slimming Data -- Exercises -- 4 Multiple Regression: Technological Changes in Jet Fighters -- 4.1 Description of Data -- 4.2 Multiple Regression Model -- 4.3 Analysis Using S-PLUS -- Exercises -- 5 Logistic Regression: Psychiatric Caseness and Mortgage Default -- 5.1 Description of Data -- 5.2 Logistic Regression and Generalised Linear Models -- 5.3 Analysis Using S-PLUS -- 5.3.1 GHQ Data -- 5.3.2 Mortgage Default Data -- Exercises -- 6 Analysing Longitudinal Data: Beating the Blues -- 6.1 Description of Data -- 6.2 Analysing Longitudinal Data -- 6.3 Analysis Using S-PLUS -- 6.3.1 Summary Measure Analysis of the Depression Data -- 6.3.2 Random Effects Models for the Depression Data -- Exercises -- 7 Nonlinear Regression and Maximum Likelihood Estimation: Athletes and Geysers -- 7.1 Description of Data -- 7.2 Nonlinear Regression and Maximum Likelihood Estimation -- 7.3 Analysis Using S-PLUS -- 7.3.1 Modelling the Olympic 1500-m Times -- 7.3.2 Estimating the Parameters in a Mixture Fitted to the Geyser Eruption Data -- Exercises -- 8 Survival Analysis: Motion Sickness and Bird Survival -- 8.1 Description of Data -- 8.2 Describing Survival Times and Cox’s Regression -- 8.2.1 The Survival Function -- 8.2.2 The Hazard Function -- 8.3 Analysis Using S-PLUS -- 8.3.1 Motion Sickness -- 8.3.2 Bird Deaths -- Exercises -- 9 Exploring Multivariate Data: Male Egyptian Skulls -- 9.1 Description of Data -- 9.2 Exploring Multivariate Data -- 9 3 Analysis Using S-PLUS -- Exercises -- 10 Cluster Analysis: Low Temperatures and Voting in Congress -- 10.1 Description of Data -- 10.2 Cluster Analysis -- 10.3 Analysis Using S-PLUS -- 10.3.1 Clustering Cities in the United States on the Basis of their Year-Round Lowest Temperature -- 10.3.2 Classifying New Jersey Congresspeople on the Basis of their Voting Behaviour -- Exercises -- 11 Bivariate Density Estimation and Discriminant Analysis: Blood Fat Concentration -- 11.1 Description of Data -- 11.2 Bivariate Density Estimation and Discriminant Function Analysis -- 11.3 Analysis Using S-PLUS -- 11.3.1 Bivariate Density Estimation -- 11.3.2 Discriminant Analysis -- Exercises -- Appendix A The S-PLUS Language -- A1 Vectors and Matrices -- A2 List Objects -- A3 Data Frames -- A4 Reading-in Data into S-PLUS -- A5 S-PLUS Functions -- A6 Graphics -- A7 User Functions -- Appendix B Answers to Selected Exercises -- References -- Index.
Recenzii
"For those who...find learning by example to be efficient and effective, the book is a worthwhile investment. …useful as a way for students or applied statisticians to get up to speed quickly on using S-Plus. …The book has several strengths: It is well organized and easy to read; The examples cover a broad range of standard statistical methods, and are general enough to be understood by readers from a variety of disciplines; At the same time, the examples are involved enough to provide substantive engagement with the software ...There is enough statistical background to flesh out the examples, but not so much that the emphasis on learning the software is lost.
"…This volume is a worthwhile investment for students or statisticians who want to improve their facility with S-Plus and who learn well from examples."
— The American Statistician. Judith Manola, Dana-Farber Cancer Institute
“The book does a nice job working with the biggest differentiator for S-PLUS … the book really works best to help persons familiar with statistical tools as they get started on analyses using S-Plus.”
— Eric R. Ziegel, Technometrics, August 2002
Descriere
S-PLUS is the statistical software of choice for many applied researchers in disciplines ranging from finance to medicine. This book focuses on statistical techniques, applies them to one or more data sets, and shows how to generate the proposed analysis and graphics using S-PLUS.
