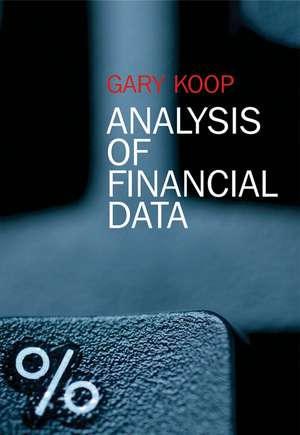
Analysis of Financial Data
Autor G Koopen Limba Engleză Paperback – 24 noi 2005
Preț: 468.32 lei
Preț vechi: 608.21 lei
-23% Nou
Puncte Express: 702
Preț estimativ în valută:
89.62€ • 93.00$ • 74.91£
89.62€ • 93.00$ • 74.91£
Carte tipărită la comandă
Livrare economică 15-29 martie
Preluare comenzi: 021 569.72.76
Specificații
ISBN-13: 9780470013212
ISBN-10: 0470013214
Pagini: 252
Ilustrații: Illustrations
Dimensiuni: 168 x 244 x 14 mm
Greutate: 0.48 kg
Editura: Wiley
Locul publicării:Chichester, United Kingdom
ISBN-10: 0470013214
Pagini: 252
Ilustrații: Illustrations
Dimensiuni: 168 x 244 x 14 mm
Greutate: 0.48 kg
Editura: Wiley
Locul publicării:Chichester, United Kingdom
Public țintă
Analysis of Financial Data has been written for first/second year undergraduate and MBA students taking introductory courses in the analysis of financial data.Cuprins
Preface.
Chapter 1: Introduction.
Organization of the book.
Useful background.
Appendix 1.1: Concepts in mathematics used in this book.
Chapter 2: Basic data handling.
Types of financial data.
Obtaining data.
Working with data: graphical methods.
Working with data: descriptive statistics.
Expected values and variances.
Chapter summary.
Appendix 2.1: Index numbers.
Appendix 2.2: Advanced descriptive statistics.
Chapter 3: Correlation.
Understanding correlation.
Understanding why variables are correlated.
Understanding correlation through XY-plots.
Correlation between several variables.
Covariances and population correlations.
Chapter summary.
Appendix 3.1: Mathematical details.
Chapter 4: An introduction to simple regression.
Regression as a best fitting line.
Interpreting OLS estimates.
Fitted values and R²: measuring the fit of a regression model.
Nonlinearity in regression.
Chapter summary.
Appendix 4.1: Mathematical details.
Chapter 5: Statistical aspects of regression.
Which factors affect the accuracy of the estimate ß?
Calculating a confidence interval for ß.
Testing whether ß = 0.
Hypothesis testing involving R²: the F-statistic.
Chapter summary.
Appendix 5.1: Using statistical tables for testing whether ß = 0.
Chapter 6: Multiple regression.
Regression as a best fitting line.
Ordinary least squares estimation of the multiple regression model.
Statistical aspects of multiple regression.
Interpreting OLS estimates.
Pitfalls of using simple regression in a multiple regression context.
Omitted variables bias.
Multicollinearity.
Chapter summary.
Appendix 6.1: Mathematical interpretation of regression coefficients.
Chapter 7: Regression with dummy variables.
Simple regression with a dummy variable.
Multiple regression with dummy variables.
Multiple regression with both dummy and non-dummy explanatory variables.
Interacting dummy and non-dummy variables.
What if the dependent variable is a dummy?
Chapter summary.
Chapter 8: Regression with lagged explanatory variables.
Aside on lagged variables.
Aside on notation.
Selection of lag order.
Chapter summary.
Chapter 9: Univariate time series analysis.
The autocorrelation function.
The autoregressive model for univariate time series.
Nonstationary versus stationary time series.
Extensions of the AR(1) model.
Testing in the AR( p) with deterministic trend model.
Chapter summary.
Appendix 9.1: Mathematical intuition for the AR(1) model.
Chapter 10: Regression with time series variables.
Time series regression when X and Y are stationary.
Time series regression when Y and X have unit roots: spurious regression.
Time series regression when Y and X have unit roots: cointegration.
Time series regression when Y and X are cointegrated: the error correction model.
Time series regression when Y and X have unit roots but are not cointegrated.
Chapter summary.
Chapter 11: Regression with time series variables with several equations.
Granger causality.
Vector autoregressions.
Chapter summary.
Appendix 11.1: Hypothesis tests involving more than one coefficient.
Appendix 11.2: Variance decompositions.
Chapter 12: Financial volatility.
Volatility in asset prices: Introduction.
Autoregressive conditional heteroskedasticity (ARCH).
Chapter summary.
Appendix A: Writing an empirical project.
Description of a typical empirical project.
General considerations.
Appendix B: Data directory.
Index.
Descriere
Analysis of Financial Data teaches basic methods and techniques of data analysis to finance students. It covers many of the major tools used by the financial economist i.e. regression and time series methods including discussion of nonstationary models, multivariate concepts such as cointegration and models of conditional volatility.


