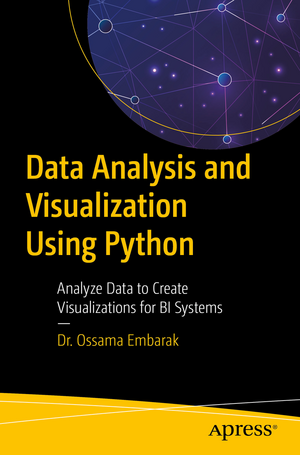
Data Analysis and Visualization Using Python: Analyze Data to Create Visualizations for BI Systems
Autor Dr. Ossama Embaraken Limba Engleză Paperback – 20 noi 2018
Look at Python from a data science point of view and learn proven techniques for data visualization as used in making critical business decisions. Starting with an introduction to data science with Python, you will take a closer look at the Python environment and get acquainted with editors such as Jupyter Notebook and Spyder. After going through a primer on Python programming, you will grasp fundamental Python programming techniques used in data science. Moving on to data visualization, you will see how it caters to modern business needs and forms a key factor in decision-making. You will also take a look at some popular data visualization libraries in Python.
Shifting focus to data structures, you will learn the various aspects of data structures from a data science perspective. You will then work with file I/O and regular expressions in Python, followed by gathering and cleaning data. Moving on to exploring and analyzing data, you will look at advanced data structures in Python. Then, you will take a deep dive into data visualization techniques, going through a number of plotting systems in Python.
In conclusion, you will complete a detailed case study, where you’ll get a chance to revisit the concepts you’ve covered so far.
- Use Python programming techniques for data science
- Master data collections in Python
- Create engaging visualizations for BI systems
- Deploy effective strategies for gathering and cleaning data
- Integrate the Seaborn and Matplotlib plotting systems
Who This Book Is For
Developers with basic Python programming knowledge looking to adopt key strategies for data analysis and visualizations using Python.
Preț: 371.01 lei
Preț vechi: 463.76 lei
-20% Nou
Puncte Express: 557
Preț estimativ în valută:
70.100€ • 74.46$ • 59.10£
70.100€ • 74.46$ • 59.10£
Carte disponibilă
Livrare economică 11-25 martie
Preluare comenzi: 021 569.72.76
Specificații
ISBN-13: 9781484241080
ISBN-10: 1484241088
Pagini: 165
Ilustrații: XX, 374 p. 267 illus.
Dimensiuni: 155 x 235 x 27 mm
Greutate: 0.55 kg
Ediția:1st ed.
Editura: Apress
Colecția Apress
Locul publicării:Berkeley, CA, United States
ISBN-10: 1484241088
Pagini: 165
Ilustrații: XX, 374 p. 267 illus.
Dimensiuni: 155 x 235 x 27 mm
Greutate: 0.55 kg
Ediția:1st ed.
Editura: Apress
Colecția Apress
Locul publicării:Berkeley, CA, United States
Cuprins
Chapter 1: Introduction to data science with python.- Chapter 2: The importance of data visualization in business intelligence.- Chapter 3: Data collections structure.- Chapter 4: File I/O processing & Regular expressions.- Chapter 5: Data gathering and cleaning.- Chapter 6: Data exploring and analysis.- Chapter 7: Data visualization.- Chapter 8: Case Study.
Notă biografică
Dr. Ossama Embarak holds a Doctorate in Computer Science from the Heriot-Watt University in Scotland, UK. He has more than 2 decades of training and teaching experience with a number of programming languages including C++, Java, C#, R, and Python. He is presently the lead CIS Program Coordinator for Higher Colleges of Technology, UAE’s largest applied higher educational institution, with over 23,000 students attending campuses throughout the region.
Recently, he got an interdisciplinary research grant of 199000 AED to implement a machine learning system for mining students’ knowledge and skills.
He has participated in many scholarly activities as a reviewer for journals in the field of computer and information sciences, artificial intelligence, mobile and web technologies. He has published numerous papers in datamining and knowledge discovery, and was also involved as a co-chair for the Technical Program Committee (TPC) for various regional and international conferences.
Textul de pe ultima copertă
Look at Python from a data science point of view and learn proven techniques for data visualization as used in making critical business decisions. Starting with an introduction to data science with Python, you will take a closer look at the Python environment and get acquainted with editors such as Jupyter Notebook and Spyder. After going through a primer on Python programming, you will grasp fundamental Python programming techniques used in data science. Moving on to data visualization, you will see how it caters to modern business needs and forms a key factor in decision-making. You will also take a look at some popular data visualization libraries in Python.
Shifting focus to data structures, you will learn the various aspects of data structures from a data science perspective. You will then work with file I/O and regular expressions in Python, followed by gathering and cleaning data. Moving on to exploring and analyzing data, you will look at advanced data structures in Python. Then, you will take a deep dive into data visualization techniques, going through a number of plotting systems in Python.
In conclusion, you will complete a detailed case study, where you’ll get a chance to revisit the concepts you’ve covered so far.
You will:
- Use Python programming techniques for data science
- Master data collections in Python
- Create engaging visualizations for BI systems
- Deploy effective strategies for gathering and cleaning data
- Integrate the Seaborn and Matplotlib plotting systems
Caracteristici
Features a detailed business case on effective strategies on data visualization Covers abstraction of the Series and DataFrames Includes a business case study in the concluding chapter of the book
