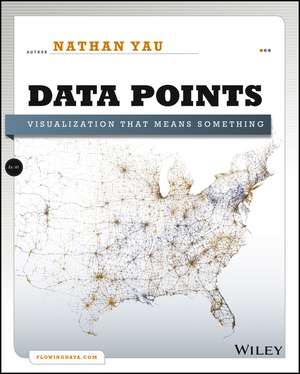
Data Points – Visualization That Means Something
Autor N Yauen Limba Engleză Paperback – 11 apr 2013
Preț: 235.45 lei
Nou
Puncte Express: 353
Preț estimativ în valută:
45.05€ • 47.26$ • 37.51£
45.05€ • 47.26$ • 37.51£
Carte disponibilă
Livrare economică 11-25 martie
Livrare express 25 februarie-01 martie pentru 47.32 lei
Preluare comenzi: 021 569.72.76
Specificații
ISBN-13: 9781118462195
ISBN-10: 111846219X
Pagini: 320
Ilustrații: illustrations
Dimensiuni: 189 x 237 x 15 mm
Greutate: 0.73 kg
Editura: Wiley
Locul publicării:Hoboken, United States
ISBN-10: 111846219X
Pagini: 320
Ilustrații: illustrations
Dimensiuni: 189 x 237 x 15 mm
Greutate: 0.73 kg
Editura: Wiley
Locul publicării:Hoboken, United States
Public țintă
Primary audience: The same audience as Visualize This, but with a wider net. Visualize This was more technical and hands–on whereas this book will explore concepts, so this book would be meant for a broader audience.Secondary audience: More advanced readers who did not need the programming guidance from Visualize This and visualization beginners who are not ready for code
Cuprins
Notă biografică
Nathan Yau has a PhD in statistics and is a statistical consultant who helps clients make use of their data through visualization. He created the popular site FlowingData.com, and is the author of Visualize This: The FlowingData Guide to Design, Visualization, and Statistics, also published by Wiley.
Descriere
A fresh look at visualization from the author of Visualize This Whether it's statistical charts, geographic maps, or the snappy graphical statistics you see on your favorite news sites, the art of data graphics or visualization is fast becoming a movement of its own.


