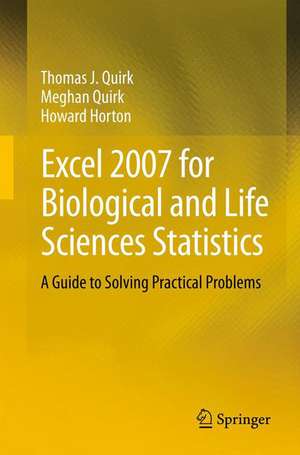
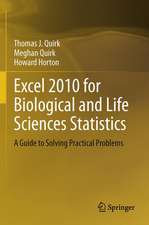
Excel 2007 for Biological and Life Sciences Statistics: A Guide to Solving Practical Problems
Autor Thomas J. Quirk, Meghan Quirk, Howard Hortonen Limba Engleză Paperback – 14 noi 2012
Excel, a widely available computer program for students and managers, is also an effective teaching and learning tool for quantitative analyses in science courses. Its powerful computational ability and graphical functions make learning statistics much easier than in years past. However, Excel 2007 for Biological and Life Sciences Statistics: A Guide to Solving Practical Problems is the first book to capitalize on these improvements by teaching students and managers how to apply Excel to statistical techniques necessary in their courses and work.
Each chapter explains statistical formulas and directs the reader to use Excel commands to solve specific, easy-to-understand science problems. Practice problems are provided at the end of each chapter with their solutions in an appendix. Separately, there is a full Practice Test (with answers in an Appendix) that allows readers to test what they have learned.
Preț: 422.31 lei
Nou
Puncte Express: 633
Preț estimativ în valută:
80.81€ • 84.21$ • 66.91£
80.81€ • 84.21$ • 66.91£
Carte tipărită la comandă
Livrare economică 03-17 aprilie
Preluare comenzi: 021 569.72.76
Specificații
ISBN-13: 9781461460022
ISBN-10: 1461460026
Pagini: 232
Ilustrații: XVII, 232 p. 162 illus., 146 illus. in color.
Dimensiuni: 155 x 235 x 15 mm
Greutate: 0.44 kg
Ediția:2013
Editura: Springer
Colecția Springer
Locul publicării:New York, NY, United States
ISBN-10: 1461460026
Pagini: 232
Ilustrații: XVII, 232 p. 162 illus., 146 illus. in color.
Dimensiuni: 155 x 235 x 15 mm
Greutate: 0.44 kg
Ediția:2013
Editura: Springer
Colecția Springer
Locul publicării:New York, NY, United States
Public țintă
Upper undergraduateCuprins
Sample Size, Mean, Standard Deviation, and Standard Error of the Mean.- Random Number Generator.- Confidence Interval About the Mean Using the TINV Function and Hypothesis Testing.- One-Group t-Test for the Mean.- Two-Group t-Test of the Difference of the Means for Independent Groups.- Correlation and Simple Linear Regression.- Multiple Correlation and Multiple Regression.- One-Way Analysis of Variance (ANOVA) .- Appendix A: Answers to End-of-Chapter Practice Problems.- Appendix B: Practice Test.- Appendix C: Answers to Practice Test.- Appendix D: Statistical Formulas.- Appendix E: t-table.- Index
Notă biografică
At the beginning of his academic career, Prof. Quirk spent six years in educational research at The American Institutes for Research and Educational Testing Service. He is currently a Professor of Marketing in the George Herbert Walker School of Business & Technology at Webster University based in St. Louis, Missouri (USA) where he teaches Marketing Statistics, Marketing Research, and Pricing Strategies. He has written 60+ textbook supplements in Marketing and Management, published 20+ articles in professional journals, and presented 20+ papers at professional meetings. He holds a B.S. in Mathematics from John Carroll University, both an M.A. in Education and a Ph.D. in Educational Psychology from Stanford University, and an M.B.A. from The University of Missouri-St. Louis. This is Professor Quirk’s eighth statistics book with Springer.
Meghan Quirk holds both a Ph.D. in Biological Education and an M.A. in Biological Sciences from the University of Northern Colorado (UNC) and a B.A. in Biology and Religion at Principia College in Elsah, Illinois. She has done research on foodweb dynamics at Wind Cave National Park in South Dakota and research in agro-ecology in Southern Belize. She has co-authored an article on shortgrass steppe ecosystems in Photochemistry & Photobiology and has presented papers at the Shortgrass Steppe Symposium in Fort Collins, Colorado, the Long-term Ecological Research All Scientists Meeting in Estes Park, Colorado, and participated in the NSF Site Review of the Shortgrass Steppe Long Term Ecological Research in Nunn, Colorado. She is a National Science Foundation Fellow GK-12, and currently teaches elementary school science in Bailey, Colorado.
Howard Horton holds an MS in Biological Sciences from the University of Northern Colorado (UNC) and a BS in Biological Sciences from Mesa State College. He has worked on research projects in Pawnee National Grasslands, Rocky Mountain National Park,Long Term Ecological Research at Toolik Lake, Alaska, and Wind Cave, South Dakota. He has co-authored articles in The International Journal of Speleology and The Journal of Cave and Karst Studies. He is a National Science Foundation Fellow GK-12, and is currently a District Wildlife Manager with the Colorado Division of Parks and Wildlife.
Textul de pe ultima copertă
This is the first book to show the capabilities of Microsoft Excel to teach biological and life sciences statistics effectively. It is a step-by-step exercise-driven guide for students and practitioners who need to master Excel to solve practical science problems. If understanding statistics isn’t your strongest suit, you are not especially mathematically-inclined, or if you are wary of computers, this is the right book for you.
Excel, a widely available computer program for students and managers, is also an effective teaching and learning tool for quantitative analyses in science courses. Its powerful computational ability and graphical functions make learning statistics much easier than in years past. However, Excel 2007 for Biological and Life Sciences Statistics: A Guide to Solving Practical Problems is the first book to capitalize on these improvements by teaching students and managers how to apply Excel to statistical techniques necessary in their courses and work.
Each chapter explains statistical formulas and directs the reader to use Excel commands to solve specific, easy-to-understand science problems. Practice problems are provided at the end of each chapter with their solutions in an appendix. Separately, there is a full Practice Test (with answers in an Appendix) that allows readers to test what they have learned.
n Includes 162 illustrations in color
n Suitable for undergraduates or graduate students
Caracteristici
Suitable for undergraduates or graduate students Includes 162 color screen shots so you can be sure you are performing Excel steps correctly Statistical theory and formulas are explained in clear language without bogging you down in mathematical fine points You will be told each step of the way, not only how to use Excel, but also why you are doing each step – so you can learn the techniques to apply Excel beyond this book. You will learn both how to write statistical formulas and how to use drop-down menus to have Excel create formulas for you Each chapter includes specific objectives for each concept so you know the purpose of the Excel steps Each chapter presents key steps needed to solve practical science problems using Excel. In addition, three practice problems at the end of each chapter enable you to test your new knowledge. Answers to these problems appear in Appendix A. A “Practice Test” is given in Appendix B to test your knowledge at the end of the book. Answers appear in Appendix C. This book purposely does not include a CD of Excel files. Instead, you’ll be shown how to create each Excel file yourself. In a work situation, your colleagues will not give you an Excel file. You will be expected to create your own. This book will give you ample practice in developing this important skill. This book is a tool that can be used either by itself or along with any good statistics book. Includes supplementary material: sn.pub/extras
