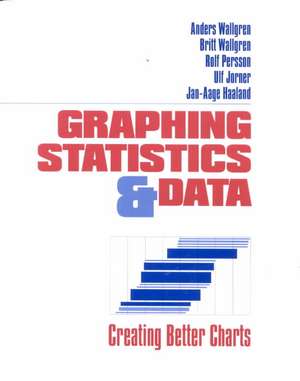
Graphing Statistics & Data: Creating Better Charts
Autor Anders Wallgren, Britt Wallgren, Rolf Persson, Ulf Jorner, Jan-Aage Haalanden Limba Engleză Paperback – 13 oct 1996
Throughout the book, the authors use numerous examples of real data as a basis of the maps and charts. They also include a chapter that shows step-by-step how to work from the data to the finished chart. Practical textual information serves as a guide for executing each stage of preparing a chart or graph.
Sound charts do not draw attention to themselves for their own sake but make the reader aware of the qualities of statistical data. Graphing Statistics & Data enables readers to create charts that effectively present their data.
Preț: 917.60 lei
Preț vechi: 1119.02 lei
-18% Nou
Puncte Express: 1376
Preț estimativ în valută:
175.64€ • 190.85$ • 147.63£
175.64€ • 190.85$ • 147.63£
Carte tipărită la comandă
Livrare economică 21 aprilie-05 mai
Preluare comenzi: 021 569.72.76
Specificații
ISBN-13: 9780761905998
ISBN-10: 0761905995
Pagini: 94
Ilustrații: 1
Dimensiuni: 210 x 270 x 6 mm
Greutate: 0.27 kg
Ediția:1
Editura: SAGE Publications
Colecția Sage Publications, Inc
Locul publicării:Thousand Oaks, United States
ISBN-10: 0761905995
Pagini: 94
Ilustrații: 1
Dimensiuni: 210 x 270 x 6 mm
Greutate: 0.27 kg
Ediția:1
Editura: SAGE Publications
Colecția Sage Publications, Inc
Locul publicării:Thousand Oaks, United States
Recenzii
"This is a short, easy-to-read book about the basics of chart-making. Unlike many survey texts, the authors take clear stands on most issues, leaving the reader with a list of ‘dos’ and ‘don’ts’ for nearly every type of chart. . . . This is a good book to have handy when disputes arise about a graphic’s design, such as between the statistician and a client or graphic artist. . . . This book would be a welcome addition to every statistician’s bookshelf."
"A belated thanks for sending Graphing Statistics & Data. It is much better than the book I have been using. It is clear, well-written, and practical. Indiana University will be using it both for graduate and undergraduate classes."
"A belated thanks for sending Graphing Statistics & Data. It is much better than the book I have been using. It is clear, well-written, and practical. Indiana University will be using it both for graduate and undergraduate classes."
Cuprins
The Power of Charts
Choosing Chart Types
The Building Blocks of Charts
Bar Charts
Our Basic Chart
Showing Frequencies
Showing Development over Time
Showing Relationship
Showing Variation
Showing Flows
Showing Geographical Variation
Some Chart Philosophy
Charts and Layout
Charts in Practice
Check-List
Choice of Technology for Producing Charts
Descriere
This book introduces the technique and art of producing good charts. Carefully written with many examples and illustrations, the book begins with an introduction to the building blocks of charts (axes, scales and patterns) and then describes each step involved in creating effective and easy-to-read charts.


