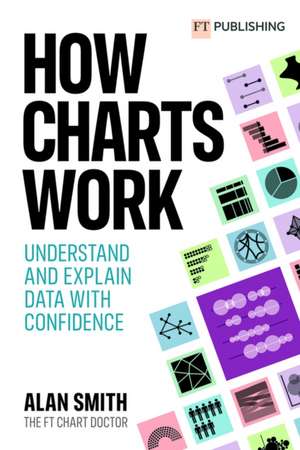
How Charts Work: Understand and explain data with confidence
Autor Alan Smithen Limba Engleză Paperback – 12 oct 2022
Preț: 93.28 lei
Nou
Puncte Express: 140
Preț estimativ în valută:
17.85€ • 19.09$ • 14.88£
17.85€ • 19.09$ • 14.88£
Carte disponibilă
Livrare economică 27 martie-10 aprilie
Livrare express 13-19 martie pentru 31.16 lei
Preluare comenzi: 021 569.72.76
Specificații
ISBN-13: 9781292342795
ISBN-10: 129234279X
Pagini: 336
Dimensiuni: 155 x 229 x 25 mm
Greutate: 0.51 kg
Editura: Pearson Education
ISBN-10: 129234279X
Pagini: 336
Dimensiuni: 155 x 229 x 25 mm
Greutate: 0.51 kg
Editura: Pearson Education
Notă biografică
Alan Smith is Head of Visual and Data Journalism at Financial Times. A data visualization specialist, he writes the FT's popular "Chart Doctor" column. Alan is an experienced presenter, having lectured extensively on how to communicate with data. His TEDx talk, "Why you should love statistics," was a TED.com featured talk in 2017. Previously, he worked at the UK's Office for National Statistics, where he founded its award-winning Data Visualisation Centre. Alan received a BA in geography from the University of Lancaster and holds an MSc in GIS from Salford University. He was appointed Officer of the Order of the British Empire (OBE) in Queen Elizabeth II's 2011 Birthday Honours list.
Cuprins
Foreword
Acknowledgements
1. Why you need this book
2. Why charts matter
PART 1 - KNOW YOUR CHARTS
3. The FT Visual Vocabulary
4. Charts of magnitude
5. Charts of change over time
6. Charts of correlation
7. Charts of distribution
8. Charts of flow
9. Charts of ranking
10. Charts of deviation
11. Charts of part to whole
12. Spatial is special
PART 2 - PUTTING CHARTS TO WORK
13. Using the Visual Vocabulary in your own organisation
14. The science behind good charts
15. Scales of justice, axes of evil
16. The best charts are well written
17. Designing for charts
18. Visualising uncertainty - a case study


