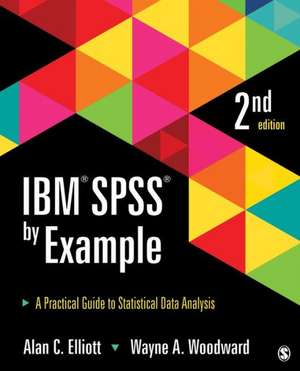
IBM SPSS by Example: A Practical Guide to Statistical Data Analysis
Autor Alan C. Elliott, Wayne A. Woodwarden Limba Engleză Paperback – 16 mar 2015
New to this edition:
- Step-by-step SPSS instructions have been integrated into every example.
- An all-new chapter describes the three methods used by SPSS to create graphics.
- A new Chapter 10 on Factor Analysis has been added.
- Examples in every chapter have been enhanced with added discussion and more detail.
- Additional screen shots and a redesigned format make the book easier to read and information easier to locate.
- All examples have been updated to reflect features in the latest version of SPSS.
Preț: 259.42 lei
Preț vechi: 505.26 lei
-49% Nou
Puncte Express: 389
Preț estimativ în valută:
49.64€ • 52.07$ • 41.32£
49.64€ • 52.07$ • 41.32£
Carte indisponibilă temporar
Doresc să fiu notificat când acest titlu va fi disponibil:
Se trimite...
Preluare comenzi: 021 569.72.76
Specificații
ISBN-13: 9781483319032
ISBN-10: 1483319032
Pagini: 368
Dimensiuni: 187 x 232 x 19 mm
Greutate: 0.56 kg
Ediția:Second Edition
Editura: SAGE Publications
Colecția Sage Publications, Inc
Locul publicării:Thousand Oaks, United States
ISBN-10: 1483319032
Pagini: 368
Dimensiuni: 187 x 232 x 19 mm
Greutate: 0.56 kg
Ediția:Second Edition
Editura: SAGE Publications
Colecția Sage Publications, Inc
Locul publicării:Thousand Oaks, United States
Recenzii
“This text not only helps the user to quickly navigate SPSS, but also provides critical aspects of each of the tests… I do not think that there is a better text for SPSS users who are looking for a quick introduction and succinct guidance.”
“All in all, [this text] will become an indispensable tool for anyone that seeks to use statistical procedures to analyze data and to report the same effectively.”
“[This text is] very readable and comprehensible for intermediate level students.”
“All in all, [this text] will become an indispensable tool for anyone that seeks to use statistical procedures to analyze data and to report the same effectively.”
“[This text is] very readable and comprehensible for intermediate level students.”
Cuprins
Chapter 1: Introduction
Getting the Most Out of IBM SPSS by Example
A Brief Overview of the Statistical Process
Understanding Hypothesis Testing, Power, and Sample Size
Understanding the p-Value
Planning a Successful Analysis
Guidelines for Creating Data Sets
Preparing Excel Data for Import
Guidelines for Reporting Results
Opening Data Files for Examples
Chapter 2: Describing and Examining Data
Example Data Files
Describing Quantitative Data
Describing Categorical Data
Chapter 3: Creating and Using Graphs
Introduction to SPSS Graphs
Chart Builder
Graphboard Template Chooser
Legacy Plots
Scatterplots
Histograms
Bar Charts
Pie Charts
Box Plots
Chapter 4: Comparing One or Two Means Using the t-Test
One-Sample t-Test
Two-Sample t-Test
Paired t-Test
Chapter 5: Correlation and Regression
Correlation Analysis
Simple Linear Regression
Multiple Linear Regression
Chapter 6: Analysis of Categorical Data
Contingency Table Analysis
McNemar’s Test
Mantel-Haenszel Comparison
Tests of Interrater Reliability
Goodness-of-Fit Test
Other Measures of Association for Categorical Data
Chapter 7: Analysis of Variance and Covariance
One-Way ANOVA
Two-Way Analysis of Variance
Repeated-Measures Analysis of Variance
Analysis of Covariance
Chapter 8: Non-parametric Analysis Procedures
Spearman’s Rho
Mann-Whitney-Wilcoxon (Two Independent Groups Test)
Kruskal-Wallis Test
Sign Test and Wilcoxon Signed-Rank Test for Matched Pairs
Friedman’s Test
Chapter 9: Logistic Regression
Simple Logistic Regression
Multiple Logistic Regression
Chapter 10: Factor Analysis
Factor Analysis Examples
Notă biografică
Descriere
Containing numerous step-by-step examples throughout, this new edition introduces readers to how to use IBM SPSS to plan a study, prepare data for analysis, perform the analysis and interpret the output.
