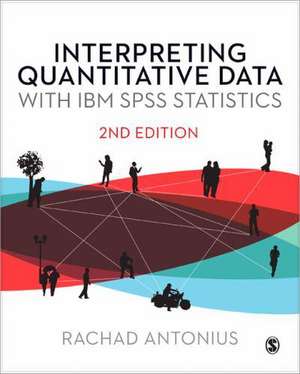
Interpreting Quantitative Data with IBM SPSS Statistics
Autor Rachad Antoniusen Limba Engleză Paperback – 20 noi 2012
- new chapters on one-way and two-way ANOVA, the Chi-square test and linear regression.
- SPSS lab sessions following each chapter which demonstrate how SPSS can be used in practice
- sets of exercises and 'real-life' examples to aid teaching and learning
- lists of key terms to aid revision and further reading to enhance students' understanding
- an improved text design making the book easier to navigate
- a companion website with answers to the labs and exercises, along with additional data sets and powerpoint slides
Preț: 450.72 lei
Preț vechi: 530.26 lei
-15% Nou
86.24€ • 90.53$ • 71.58£
Carte tipărită la comandă
Livrare economică 10-24 aprilie
Specificații
ISBN-10: 1446207439
Pagini: 376
Ilustrații: black & white illustrations, black & white tables, figures
Dimensiuni: 186 x 232 x 20 mm
Greutate: 0.64 kg
Ediția:Second Edition
Editura: SAGE Publications
Colecția Sage Publications Ltd
Locul publicării:London, United Kingdom
Recenzii
Interpreting Quantitative Data with IBM SPSS Statistics is a well-produced book which is clearly written in a reader-friendly style. The topics progress logically and are clearly explained. Unlike many books for the student quantitative researcher the author spends time not only on the interpretation of the data but also on the skill of presenting the findings in report form, both formally and informally. This is an essential skill that is often not taught with potentially disastrous results when the student comes to present his/her dissertation.
I can thoroughly recommend this book both as a set text for an introductory course in quantitative methods in the social sciences and as a text for those who are working alone without the guidance of a tutor. For those of us whose introductory courses are lost in the mists of time this book is an excellent revision aide. I certainly found bits of information that I had long forgotten.
Cuprins
PART ONE INTRODUCTION TO QUANTITATIVE METHODS
The Basic Language of Statistics
The Research Process
PART TWO DESCRIPTIVE STATISTICS
Univariate Descriptive Statistics
Graphical Representations
PART THREE METHODOLOGICAL TOOLS
Creating New Variables with SPSS
Normal Distributions and Sampling Distributions
Sampling Designs
PART FOUR INFERENTIAL STATISTICS
Estimation
Hypothesis-Testing
PART FIVE
Correlation and the Regression Line
Two-Way Tables and the Chi-Squared Test
<i>t</i>-tests and ANOVA
Appendix I: Reporting a Quantitative Analysis
Appendix II: How to Create a Data File in SPSS
Appendix III: Areas Under the Normal Curve
Appendix IV: Table of Random Numbers
Glossary
Descriere
The second edition of Interpreting Quantitative Data with IBM SPSS Statistics is an invaluable resource for students analysing quantitative data for the first time. The book clearly sets out a range of statistical techniques and their common applications, explaining their logic and links to the research process. It also shows how SPSS can be used as a tool to aid analysis. Key features of the second edition include:
- new chapters on one-way and two-way ANOVA, the Chi-square test and linear regression.
- SPSS lab sessions following each chapter which demonstrate how SPSS can be used in practice
- sets of exercises and 'real-life' examples to aid teaching and learning
- lists of key terms to aid revision and further reading to enhance students' understanding
- an improved text design making the book easier to navigate
- a companion website with answers to the labs and exercises, along with additional data sets and powerpoint slides


