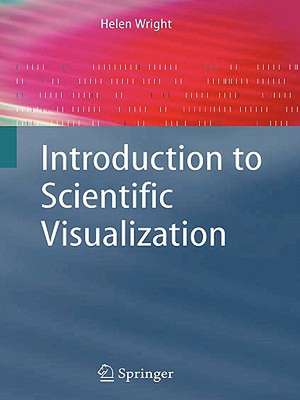
Introduction to Scientific Visualization
Autor Helen Wrighten Limba Engleză Paperback – 29 noi 2006
Preț: 331.40 lei
Preț vechi: 414.26 lei
-20% Nou
Puncte Express: 497
Preț estimativ în valută:
63.43€ • 68.93$ • 53.32£
63.43€ • 68.93$ • 53.32£
Carte tipărită la comandă
Livrare economică 21 aprilie-05 mai
Preluare comenzi: 021 569.72.76
Specificații
ISBN-13: 9781846284946
ISBN-10: 1846284945
Pagini: 147
Ilustrații: XIII, 147 p.
Dimensiuni: 155 x 235 x 10 mm
Greutate: 0.39 kg
Ediția:2007
Editura: SPRINGER LONDON
Colecția Springer
Locul publicării:London, United Kingdom
ISBN-10: 1846284945
Pagini: 147
Ilustrații: XIII, 147 p.
Dimensiuni: 155 x 235 x 10 mm
Greutate: 0.39 kg
Ediția:2007
Editura: SPRINGER LONDON
Colecția Springer
Locul publicării:London, United Kingdom
Public țintă
Professional/practitionerCuprins
Potential and Pitfalls.- Models and Software.- Colour in Scientific Visualization.- Choosing Techniques.- Visualizing Scalars.- Visualizing Vectors.- Bibliography and Further Reading.
Recenzii
From the reviews:
"Wright, after an overview of the field, presents the basics of color, provides an exemplary taxonomy of visualization techniques … . the book also contains a bibliography, references, solutions to exercises, a list of useful Web sites, common abbreviations, a glossary, and a comprehensive index. … all the visualization techniques are lucidly described, with clear … examples, corresponding charts, and color plates. … Readers looking for a short and accessible introduction to visualization techniques can’t go wrong with Wright’s book." (D. Spinellis, ACM Computing Reviews, September, 2008)
"Wright, after an overview of the field, presents the basics of color, provides an exemplary taxonomy of visualization techniques … . the book also contains a bibliography, references, solutions to exercises, a list of useful Web sites, common abbreviations, a glossary, and a comprehensive index. … all the visualization techniques are lucidly described, with clear … examples, corresponding charts, and color plates. … Readers looking for a short and accessible introduction to visualization techniques can’t go wrong with Wright’s book." (D. Spinellis, ACM Computing Reviews, September, 2008)
Textul de pe ultima copertă
Scientific visualization is recognised as important for understanding data, whether measured, sensed remotely or calculated. Introduction to Scientific Visualization is aimed at readers who are new to the subject, either students taking an advanced option at undergraduate level or postgraduates wishing to visualize some specific data.
An introductory chapter on the philosophy of the subject sets the scene, showing why visualization works and what to aim for when presenting scientific data visually. Then, extending and applying Brodlie's taxonomy to underpin its core chapters, the book shows how to classify data, choose a technique that's appropriate for its visualization, and alerts readers to some of the pitfalls before they can invalidate their conclusions. The book concludes with an annotated bibliography and suggestions for further reading.
Above all, this is a 'how to do it' book for scientific visualization, with:
- Discussion of the different types of software architecture for visualization
- Introduction to the theory of colour perception and the role of colour in conveying information about data
- Comprehensive illustrations throughout
- Exercises and problems to encourage further learning
- Virtual laboratories available from Springer’s website for those readers with access to the IRIS Explorer package
Caracteristici
The subject of scientific visualisation has primarily been covered in compilations of research papers, apart from Brodie's seminal work "Scientific Visualization Techniques and Applications" which was published in 1992. Dr Wright's book remedies this by providing a coherent and accessible approach to the subject which will be welcomed by readers. This book does not treat the subject as a subset of information visualisation, but rather as a subject in its own right Author uses straightforward language and uses a structured approach to the subject, with a non-mathematical basis. Includes supplementary material: sn.pub/extras Request lecturer material: sn.pub/lecturer-material


