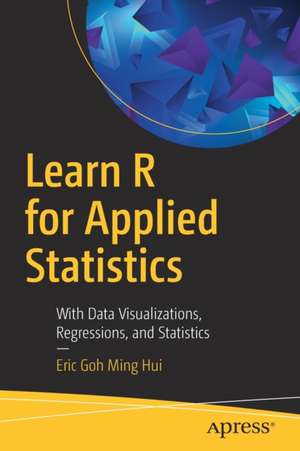
Learn R for Applied Statistics: With Data Visualizations, Regressions, and Statistics
Autor Eric Goh Ming Huien Limba Engleză Paperback – dec 2018
Gain the R programming language fundamentals for doing the applied statistics useful for data exploration and analysis in data science and data mining. This book covers topics ranging from R syntax basics, descriptive statistics, and data visualizations to inferential statistics and regressions. After learning R’s syntax, you will work through data visualizations such as histograms and boxplot charting, descriptive statistics, and inferential statistics such as t-test, chi-square test, ANOVA, non-parametric test, and linear regressions.
Learn R for Applied Statistics is a timely skills-migration book that equips you with the R programming fundamentals and introduces you to applied statistics for data explorations.
What You Will Learn
- Discover R, statistics, data science, data mining, and big data
- Master the fundamentals of R programming, including variables and arithmetic, vectors, lists, data frames, conditional statements, loops, and functions
- Work with descriptive statistics
- Create data visualizations, including bar charts, line charts, scatter plots, boxplots, histograms, and scatterplots
- Use inferential statistics including t-tests, chi-square tests, ANOVA, non-parametric tests, linear regressions, and multiple linear regressions
Who This Book Is For
Those who are interested in data science, in particular data exploration using applied statistics, and the use of R programming for data visualizations.
Preț: 277.34 lei
Preț vechi: 346.67 lei
-20% Nou
Puncte Express: 416
Preț estimativ în valută:
53.07€ • 55.66$ • 44.18£
53.07€ • 55.66$ • 44.18£
Carte disponibilă
Livrare economică 11-25 martie
Preluare comenzi: 021 569.72.76
Specificații
ISBN-13: 9781484241998
ISBN-10: 1484241991
Pagini: 145
Ilustrații: XV, 243 p. 111 illus.
Dimensiuni: 155 x 235 mm
Greutate: 0.37 kg
Ediția:1st ed.
Editura: Apress
Colecția Apress
Locul publicării:Berkeley, CA, United States
ISBN-10: 1484241991
Pagini: 145
Ilustrații: XV, 243 p. 111 illus.
Dimensiuni: 155 x 235 mm
Greutate: 0.37 kg
Ediția:1st ed.
Editura: Apress
Colecția Apress
Locul publicării:Berkeley, CA, United States
Cuprins
Chapter 1: Introduction.- Chapter 2: Getting Started.- Chapter 3: Basic .- Chapter 4: Descriptive Statistics.- Chapter 5: Data Visualizations.- Chapter 6: Inferential Statistics and Regressions.
Notă biografică
Eric Goh is a data scientist, software engineer, adjunct faculty and entrepreneur with years of experiences in multiple industries. His varied career includes data science, data and text mining, natural language processing, machine learning, intelligent system development, and engineering product design.Eric Goh has been leading his teams for various industrial projects, including the advanced product code classification system project which automates Singapore Custom’s trade facilitation process, and Nanyang Technological University's data science projects where he develop his own DSTK data science software. He has years of experience in C#, Java, C/C++, SPSS Statistics and Modeller, SAS Enterprise Miner, R, Python, Excel, Excel VBA and etc. He won Tan Kah Kee Young Inventors' Merit Award and Shortlisted Entry for TelR Data Mining Challenge. Eric Goh founded the SVBook website to offer affordable books, courses and software in data science and programming.
He holds a Masters of Technology degree from the National University of Singapore, an Executive MBA degree from U21Global (currently GlobalNxt) and IGNOU, a Graduate Diploma in Mechatronics from A*STAR SIMTech (a national research institute located in Nanyang Technological University), and Coursera Specialization Certificate in Business Statistics and Analysis from Rice University. He possessed a Bachelor of Science degree in Computing from the University of Portsmouth after National Service. He is also a AIIM Certified Business Process Management Master (BPMM), GSTF certified Big Data Science Analyst (CBDSA), and IES Certified Lecturer.
Textul de pe ultima copertă
Gain the R programming language fundamentals for doing the applied statistics useful for data exploration and analysis in data science and data mining. This book covers topics ranging from R syntax basics, descriptive statistics, and data visualizations to inferential statistics and regressions. After learning R’s syntax, you will work through data visualizations such as histograms and boxplot charting, descriptive statistics, and inferential statistics such as t-test, chi-square test, ANOVA, non-parametric test, and linear regressions.
Learn R for Applied Statistics is a timely skills-migration book that equips you with the R programming fundamentals and introduces you to applied statistics for data explorations.
You will:
- Discover R, statistics, data science, data mining, and big data
- Master the fundamentals of R programming, including variables and arithmetic, vectors, lists,data frames, conditional statements, loops, and functions
- Work with descriptive statistics
- Create data visualizations, including bar charts, line charts, scatter plots, boxplots, histograms, and scatterplots
- Use inferential statistics including t-tests, chi-square tests, ANOVA, non-parametric tests, linear regressions, and multiple linear regressions
Caracteristici
Learn R through structured and optimized, real project examples Covers applied statistics using R, first by learning R basics, then applying to data visualizations, descriptive, inferential and regressions-based statistics Explore data science using applied statistics and data visualization
