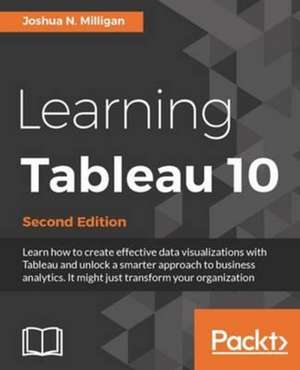
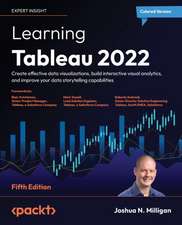
Learning Tableau 10 - Second Edition
Autor Joshua N. Milliganen Limba Engleză Paperback – 30 sep 2016
Key Features
- Create stylish visualizations and dashboards that explain complexity with clarity
- Learn effective data storytelling to transform how your business uses ideas and makes decisions
- Explore all the new features in Tableau 10 and start to redefine what business analytics means to your organization
Tableau has for some time been one of the most popular Business Intelligence and data visualization tools available. Why? Because, quite simply, it's a tool that's responsive to the needs of modern businesses. But it's most effective when you know how to get what you want from it - it might make your business intelligent, but it isn't going to make you intelligent...
We'll make sure you're well prepared to take full advantage of Tableau 10's new features. Whether you're an experienced data analyst that wants to explore 2016's new Tableau, or you're a beginner that wants to expand their skillset and bring a more professional and sharper approach to their organization, we've got you covered. Beginning with the fundamentals, such as data preparation, you'll soon learn how to build and customize your own data visualizations and dashboards, essential for high-level visibility and effective data storytelling. You'll also find out how to so trend analysis and forecasting using clustering and distribution models to inform your analytics.
But it's not just about you - when it comes to data it's all about availability and access. That's why we'll show you how to share your Tableau visualizations. It's only once insights are shared and communicated that you - and your organization - will start making smarter and informed decisions. And really, that's exactly what this guide is for.
What you will learn
- Find out how to build effective visualizations and dashboards
- Prepare and clean your data so you can be sure Tableau is finding answers to your questions - not raising more problems
- Discover how to create advanced visualizations that explain complexity with clarity and style
- Dig deeper into your data with clustering and distribution models that allow you to analyze trends and make forecasts
- Learn how to use data storytelling to aid decision-making and strategy
- Share dashboards and visualizations to cultivate a culture where data is available and valued
Got data? Not sure what to make of it? This is the guide for you - whether you've been working with Tableau for years or are just beginning your adventure into business analytics.
Preț: 341.96 lei
Preț vechi: 427.46 lei
-20% Nou
Puncte Express: 513
Preț estimativ în valută:
65.44€ • 68.63$ • 54.47£
65.44€ • 68.63$ • 54.47£
Carte tipărită la comandă
Livrare economică 01-15 aprilie
Preluare comenzi: 021 569.72.76
Specificații
ISBN-13: 9781786466358
ISBN-10: 178646635X
Pagini: 432
Dimensiuni: 191 x 235 x 24 mm
Greutate: 0.8 kg
Ediția:Second
Editura: Packt Publishing
ISBN-10: 178646635X
Pagini: 432
Dimensiuni: 191 x 235 x 24 mm
Greutate: 0.8 kg
Ediția:Second
Editura: Packt Publishing
Notă biografică
Joshua N. Milligan is a five-time Tableau Zen Master, the highest recognition of excellence from Tableau Software for masters and teachers of Tableau and collaborators within the community. He was one of three Iron Viz Global finalists in 2017. He is passionate in serving others through data visualization and analytics. As a consultant with Teknion Data Solutions since 2004, he has extensive real-world experience across many industries. In addition to authoring every edition of Learning Tableau, he was a technical reviewer for Tableau Data Visualization Cookbook and Creating Data Stories with Tableau Public. He shares Tableau and Tableau Prep tips on VizPainter and his Twitter handle is @VizPainter. He lives with his family in Tulsa.
