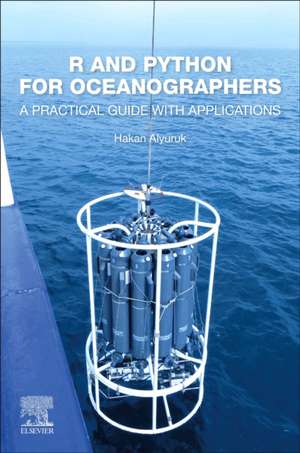
R and Python for Oceanographers: A Practical Guide with Applications
Autor Hakan Alyuruken Limba Engleză Paperback – 9 iun 2019
- Presents much needed oceanographic data analysis approaches to chemical and physical oceanography
- Includes examples with software applications (based on Python and R), including free software for the analysis of oceanographic data
- Provides guidance on how to get started, along with guidance on example code and output
Preț: 500.65 lei
Preț vechi: 654.34 lei
-23% Nou
Puncte Express: 751
Preț estimativ în valută:
95.83€ • 104.13$ • 80.55£
95.83€ • 104.13$ • 80.55£
Carte tipărită la comandă
Livrare economică 15-29 aprilie
Preluare comenzi: 021 569.72.76
Specificații
ISBN-13: 9780128134917
ISBN-10: 0128134917
Pagini: 186
Dimensiuni: 152 x 229 x 16 mm
Greutate: 0.26 kg
Editura: ELSEVIER SCIENCE
ISBN-10: 0128134917
Pagini: 186
Dimensiuni: 152 x 229 x 16 mm
Greutate: 0.26 kg
Editura: ELSEVIER SCIENCE
V-ar putea interesa
-
 Preț: 74.31 lei
 -
 -29%Preț: 488.23 lei684.75 lei
 -
 Tsunamis in the European-Mediterranean Region: From Historical Record to Risk MitigationGerassimos Papadopoulos-23%Preț: 530.70 lei691.18 lei
 -
 Coastal Ocean Observing SystemsYonggang Liu-23%Preț: 532.86 lei692.54 lei
 -
 -16%Preț: 312.59 lei372.53 lei
 -
 -23%Preț: 563.82 lei735.48 lei
 -
 Preț: 144.56 lei
 -
 Ocean Acidificationand Impacts Assessment Committee on the Development of an Integrated Science Strategy for Ocean Acidification Monitoring, ResearchPreț: 329.61 lei
 -
 -23%Preț: 706.34 lei917.31 lei
 -
 Waves in Oceanic and Coastal WatersLeo H. Holthuijsen-11%Preț: 436.28 lei490.19 lei
 -
 Troubled Waters: Ocean Science and GovernanceGeoff HollandPreț: 387.69 lei
 -
 Introductory Dynamical OceanographyStephen Pond-15%Preț: 328.65 lei387.63 lei
 -
 Pacific and Arctic OceansKallen B. Tewles-27%Preț: 651.47 lei887.13 lei
 -
 Science of OceanographyJames E. Mackin-27%Preț: 1944.83 lei2659.65 lei
 -
 Marine Protected AreasFloyd B. Mayr-27%Preț: 600.60 lei818.28 lei
 -
 Structure and Succession of Fouling CommunitiesV.V. Khalaman-23%Preț: 289.42 lei375.86 lei
 -
 EstuariesJulian R. Crane-27%Preț: 1378.97 lei1885.75 lei
 -
 The Strait of GibraltarD. Macias-26%Preț: 350.07 lei474.11 lei
Public țintă
Academic staff and students at oceanographic institutions. The book could be used as a supplementary course material in oceanography courses.The secondary market includes environmental scientists, geologists, Earth Scientists, Climatologists.
Cuprins
1. Introduction to R and Python1.1 Introduction to R1.2 R environment 1.3 Installation of R 1.4 Integrated development environments (IDEs) and editors for R1.5 Useful R commands1.6 Getting help for R1.7 Introduction to Python 1.8 Modules and packages in Python1.9 Python IDEs1.10 Installing Python and scientific Python distributions1.11 Getting help for Python1.12 Some useful packages and libraries in R and Python for oceanography
2. Data import and export in R and Python2.1 Object types in R2.2 Data import in R2.3 Data export in R2.4 Object types in Python2.5 Data import in Python2.6 Data export in Python
3. Plotting 3.1 Plots in R3.2 Plotting in Python
4. Physical oceanography examples4.1 Vertical profiling plots in R 4.2 Time-series plots in R 4.3 Temperature-salinity diagrams in R4.4 Maps in R4.5 Transect plots in R4.6 Surface plots in R4.7 Vertical profiling plots in Python 4.8 Time series plots in Python4.9 Temperature-salinity diagrams in Python4.10 Maps in Python 4.11 Transect plots in Python 4.12 Surface plots in Python 4.13 Animations in R and Python
5. Chemical oceanography examples5.1 Vertical profiling plots in R5.2 Time-series plots in R5.3 Barplots in R5.4 Boxplots in R5.5 Pie charts in R5.6 3D plots in R5.7 Ternary plots in R5.8 Vertical profiling plots in Python 5.9 Time-series plots in Python5.10 Barplots in Python5.11 Boxplots in Python5.12 Pie charts in Python5.13 3D plots in Python5.14 Ternary plots in Python