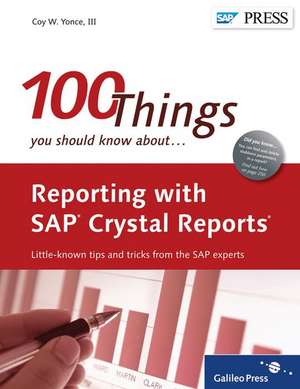
Reporting with SAP Crystal Reports: SAP Press
Autor Coy Yonceen Limba Engleză Hardback – 31 oct 2011
Have you ever spent hours on a report only to discover that you could have saved time with a simple tip? Here you go: SAP PRESS equips you with "100 Things" that unlock the secrets of reporting with SAP Crystal Reports.
With this book, users of all levels will:
1. Save timeWith the shortcuts and workarounds provided, you will learn how to complete your daily SAP Crystal Reports tasks faster and more elegantly.
2. Learn quicklyFull of screenshots and instructions, this book will help you pick up new tips and tricks in no time, such as effective formatting options or performance boosters.
3. Develop new skillsYou'll discover new ways of doing your work and find yourself saying, "I wish I'd known how to do this a long time ago!"
Highlights:
- Report layout
- Formatting
- Types of reports
- Charting
- Data connectivity
- Parameters
- Design
- Distribution
Din seria SAP Press
- 20%
 Preț: 463.74 lei
 - 20%
 Preț: 355.66 lei
 - 20%
 Preț: 182.14 lei
 - 20%
 Preț: 292.55 lei
 - 20%
 Preț: 423.68 lei
 - 20%
 Preț: 517.65 lei
 - 20%
 Preț: 392.16 lei
 - 20%
 Preț: 448.41 lei
 - 20%
 Preț: 416.61 lei
 - 20%
 Preț: 409.85 lei
 - 20%
 Preț: 463.31 lei
 - 20%
 Preț: 394.02 lei
 - 20%
 Preț: 466.22 lei
 - 20%
 Preț: 407.35 lei
 - 20%
 Preț: 455.99 lei
 - 20%
 Preț: 440.30 lei
 - 20%
 Preț: 456.80 lei
 - 20%
 Preț: 403.64 lei
 - 20%
 Preț: 533.78 lei
 - 20%
 Preț: 481.97 lei
 - 11%
 Preț: 443.33 lei
 - 20%
 Preț: 430.68 lei
 - 20%
 Preț: 469.63 lei
 -
 Preț: 425.76 lei
 - 20%
 Preț: 441.35 lei
 - 20%
 Preț: 511.08 lei
 - 20%
 Preț: 289.07 lei
 - 20%
 Preț: 691.07 lei
 - 20%
 Preț: 470.25 lei
 - 20%
 Preț: 361.49 lei
 - 20%
 Preț: 443.96 lei
 - 20%
 Preț: 315.36 lei
 - 20%
 Preț: 520.38 lei
 - 20%
 Preț: 530.48 lei
 - 20%
 Preț: 434.97 lei
 - 20%
 Preț: 441.09 lei
 - 20%
 Preț: 226.07 lei
 - 20%
 Preț: 486.00 lei
 - 20%
 Preț: 229.18 lei
 - 20%
 Preț: 398.13 lei
 - 20%
 Preț: 295.28 lei
 - 20%
 Preț: 455.93 lei
 - 20%
 Preț: 451.90 lei
 - 20%
 Preț: 415.47 lei
 - 20%
 Preț: 456.73 lei
 - 20%
 Preț: 445.01 lei
 - 20%
 Preț: 418.89 lei
 - 20%
 Preț: 420.00 lei
 - 20%
 Preț: 464.87 lei
 - 20%
 Preț: 352.57 lei
Preț: 271.38 lei
Preț vechi: 339.22 lei
-20% Nou
51.93€ • 56.39$ • 43.63£
Carte indisponibilă temporar
Specificații
ISBN-10: 1592293905
Pagini: 338
Dimensiuni: 182 x 237 x 28 mm
Greutate: 1.27 kg
Editura: Rheinwerk Verlag GmbH
Seria SAP Press
Cuprins
... Acknowledgments ... 11
PART 1 ... Report Layout ... 13
... 1 ... Creating Reports with Different Page Headers ... 14
... 2 ... Repeating Group Headers across Pages ... 17
... 3 ... Adding Watermarks to Reports ... 19
... 4 ... Setting Up Unlinked Subreports ... 22
... 5 ... Setting Up Linked Subreports ... 25
... 6 ... Using Subreports as Templates for Headers and Footers ... 28
... 7 ... Using On Demand or In Place ... 31
... 8 ... Passing Data between Subreports and Main Reports ... 34
... 9 ... Suppressing and Hiding Sections ... 38
... 10 ... Suppressing a Blank Subreport or a Section with a Blank Subreport ... 41
... 11 ... Creating Side-by-Side Reports ... 44
... 12 ... Suppressing Duplicate Rows ... 47
... 13 ... Displaying Records Horizontally ... 50
... 14 ... Displaying a Checkbox in a Report ... 52
... 15 ... Designing a Cover Page for Reports ... 54
PART 2 ... Field Formatting ... 57
... 16 ... Printing Vertical Text Fields Alongside Horizontal Text Fields ... 58
... 17 ... Concatenating Strings with Different Formats ... 61
... 18 ... Aligning the Vertical Alignment of Text in a Field ... 65
... 19 ... Inserting Leading Zeroes for a Field ... 69
... 20 ... Formatting Parts of a String ... 72
... 21 ... Forcing a Header or Footer to Grow Automatically or Remain a Specific Size ... 74
... 22 ... Displaying Values in a Field That's Based on a Parameter ... 77
... 23 ... Creating a Running Total with Values Derived from a Formula Field ... 81
... 24 ... Creating a Formula to Calculate an Average while Ignoring Zero Values ... 85
... 25 ... Creating a Formula to Calculate a Minimum while Ignoring Zero Values ... 87
... 26 ... Performing Data Type Conversions ... 90
... 27 ... Checking for the Existence of Text ... 93
PART 3 ... Types of Reports and Forms ... 97
... 28 ... Creating Reports for Immediate Decision Making ... 98
... 29 ... Creating Reports to Support Front Line Managers ... 102
... 30 ... Creating Reports for Upper-Level Management ... 105
... 31 ... Creating Mailing Labels ... 109
... 32 ... Creating an Earnings Statement for a Paycheck ... 112
... 33 ... Creating a Table of Contents for a Report ... 115
... 34 ... Creating Calendars from an Excel Spreadsheet ... 119
... 35 ... Laying Out Form Fields ... 124
PART 4 ... Guided Analysis ... 127
... 36 ... Highlighting Information ... 128
... 37 ... Showing Visual Indicators ... 131
... 38 ... Creating Tool Tips ... 133
... 39 ... Enabling Drill-Down Reporting ... 136
... 40 ... Creating a Gradual Drill-Down in a Report ... 138
... 41 ... Sorting and Ranking within a Group ... 141
... 42 ... Displaying Top N Records in a Report Based on a Parameter ... 144
... 43 ... Applying and Formatting a Sort or Rank in a Crosstab ... 147
... 44 ... Applying Color Banding to a Report ... 149
... 45 ... Creating and Using Parameters in a Report ... 152
... 46 ... Creating Dynamic Cascading Parameters ... 156
PART 5 ... Using Web Technology with Reports ... 159
... 47 ... Creating Reports from HTML Content ... 160
... 48 ... Creating Hyperlinks in a Report ... 163
... 49 ... Formatting Reports Using Cascading Style Sheets ... 166
... 50 ... Creating Reports from Local XML Documents ... 170
... 51 ... Using Web Services as a Data Source for a Report ... 172
... 52 ... Creating XML Documents Using SAP Crystal Reports ... 175
... 53 ... Publishing Reports as a Web Service ... 178
PART 6 ... Charting ... 181
... 54 ... Inserting Bar Charts in Report Details ... 182
... 55 ... Creating a Combo Chart that Contains a Bar and Line Visualization ... 185
... 56 ... Using Overlays with Complex Charting ... 188
... 57 ... Removing Decimals in the X- and Y-Axis ... 191
... 58 ... Formatting Dates in a Chart ... 195
... 59 ... Creating Visualizations with Negative Values ... 199
PART 7 ... Creating Reusable and Accessible Report Diagrams ... 203
... 60 ... Creating Effective Report Templates ... 204
... 61 ... Providing Default Formatting for a Field ... 208
... 62 ... Using Chart Styles to Eliminate Unnecessary Report Elements ... 211
... 63 ... Creating Reusable Formulas ... 215
... 64 ... Setting Default Formatting Options ... 218
... 65 ... Using Color Effectively ... 221
... 66 ... Making Text Legible ... 224
... 67 ... Ordering Report Objects for Screen Readers ... 227
... 68 ... Making Tables Accessible for Screen Readers ... 230
... 69 ... Naming Formula Fields for Ease of Use ... 232
PART 8 ... Using Parameters ... 235
... 70 ... Displaying Parameter Values in a Report ... 236
... 71 ... Creating a Parameter That Provides an ALL Value ... 239
... 72 ... Allowing Wildcards as a Parameter Value ... 241
... 73 ... Providing Users with Groupings as a Parameter Value ... 243
... 74 ... Controlling Values Entered into Parameters ... 246
... 75 ... Finding and Deleting Stubborn Parameters from a Report ... 250
... 76 ... Prompting the User for the N Value to Use for Top N Reports ... 253
PART 9 ... Distributing Reports ... 257
... 77 ... Scheduling Timely Reports ... 258
... 78 ... Running Reports Based on Events or Triggers ... 261
... 79 ... Designing Reports for Effective Excel Exports ... 264
... 80 ... Choosing the Right Excel Export Option ... 267
... 81 ... Analyzing Report Data with SAP BusinessObjects Explorer ... 270
... 82 ... Sharing Reports on the Web ... 273
... 83 ... Embedding Dynamic Reports in Microsoft Office Documents ... 275
... 84 ... Exporting Reports to XML ... 279
... 85 ... Creating Read-Only Reports ... 281
PART 10 ... Extending the Design Experience ... 285
... 86 ... Working with Files within a Report ... 286
... 87 ... Sending Emails from a Report ... 289
... 88 ... Exporting Data to CSV While Processing a Report ... 292
... 89 ... Exporting Data to XML While Processing a Report ... 295
... 90 ... Creating Barcodes in Your Reports ... 298
... 91 ... Creating QR Codes in Reports ... 300
... 92 ... Looking Up Text in an External File ... 303
... 93 ... Creating a Report Index from an Existing Report ... 305
... 94 ... Using Templates to Create Labels ... 307
... 95 ... Accessing Windows Functionality from a Report ... 310
PART 11 ... Monitoring and Improving Report Performance ... 313
... 96 ... Using a Built-in Dialogue to Monitor Report Performance ... 314
... 97 ... Using Selection Formulas to Restrict Report Queries ... 317
... 98 ... Hiding Unnecessary Data ... 320
... 99 ... Offloading the Processing of Report Functions ... 322
... 100 ... Using SQL Expressions ... 325
... The Author ... 329
... Index ... 331
