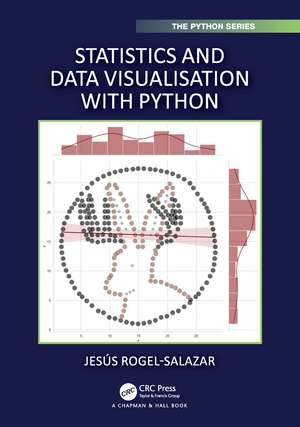
Statistics and Data Visualisation with Python: Chapman & Hall/CRC The Python Series
Autor Jesus Rogel-Salazaren Limba Engleză Paperback – 31 ian 2023
Preț: 303.85 lei
Preț vechi: 379.81 lei
-20% Nou
Puncte Express: 456
Preț estimativ în valută:
58.14€ • 60.70$ • 48.12£
58.14€ • 60.70$ • 48.12£
Carte disponibilă
Livrare economică 14-28 martie
Livrare express 27 februarie-05 martie pentru 47.07 lei
Preluare comenzi: 021 569.72.76
Specificații
ISBN-13: 9780367744519
ISBN-10: 0367744511
Pagini: 554
Ilustrații: 33 Tables, black and white; 4 Line drawings, color; 72 Line drawings, black and white; 1 Halftones, black and white; 4 Illustrations, color; 73 Illustrations, black and white
Dimensiuni: 191 x 235 x 32 mm
Greutate: 1 kg
Ediția:1
Editura: CRC Press
Colecția Chapman and Hall/CRC
Seria Chapman & Hall/CRC The Python Series
Public țintă
Academic and Professional Practice & DevelopmentCuprins
1. Data, Stats and Stories - An Introduction 2. Python Programming Primer 3. Snakes, Bears & Other Numerical Beasts: NumPy, SciPy & Pandas 4. The Measure of All Things - Statistics 5. Definitely Maybe: Probability and Distributions 6. Alluring Arguments and Ugly Facts - Statistical Modelling and Hypothesis Testing 7. Delightful Details - Data Visualisation 8. Dazzling Data Designs - Creating Charts A. Variance: Population v Sample B. Sum of First n Integers C. Sum of Squares of the First n Integers D. The Binomial Coefficient E. The Hypergeometric Distribution F. The Poisson Distribution G. The Normal Distribution H. Skewness and Kurtosis I. Kruskal-Wallis Test - No Ties
Notă biografică
Dr. Jesús Rogel-Salazar is an accomplished technologist with over 20 years' experience in the area of data science and machine learning. He obtained his PhD in quantum atom optics at Imperial College in the group of Professor Geoff New and in collaboration with the Bose–Einstein Condensation Group in Oxford with Professor Keith Burnett. After completion of his doctorate, he worked in the Centre for Cold Matter at Imperial and moved on to the Department of Mathematics in the Applied Analysis and Computation Group. Further to his academic career, Dr. Rogel-Salazar has held positions as a data scientist with AKQA, IBM Data Science Studios, Barclays, Dow Jones, Prudential and Tympa Health Technologies. He is the author of three books published with CRC Press; the latest two are entitled Data Science and Analytics with Python and Advanced Data Science and Analytics with Python.
Descriere
Statistics and Data Visualisation with Python aims to build statistical knowledge from the ground up by enabling the reader to understand the ideas behind inferential statistics, and begin to formulate hypotheses that form the foundations for the applications and algorithms in statistical analysis.


