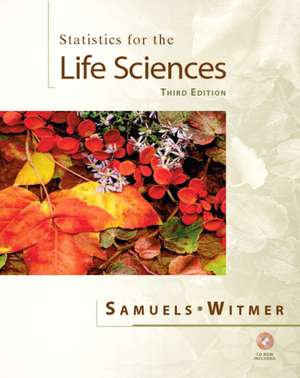
Statistics for the Life Sciences: United States Edition
Autor Myra L. Samuels, Jeffrey A. Witmeren Limba Engleză Mixed media product – 2 dec 2002
With a strong emphasis on real data, exploratory data analysis, interpretation of results, and checking assumptions, this text clearly conveys the key concepts of statistics as applied to life sciences while incorporating tools and themes of modern data analysis. The authors' goal is to help students understand concepts not memorize formulas; they make liberal use of exercises, worked examples, and graphical methods to do so.
Preț: 662.10 lei
Preț vechi: 859.87 lei
-23% Nou
Puncte Express: 993
Preț estimativ în valută:
126.69€ • 132.28$ • 104.85£
126.69€ • 132.28$ • 104.85£
Carte indisponibilă temporar
Doresc să fiu notificat când acest titlu va fi disponibil:
Se trimite...
Preluare comenzi: 021 569.72.76
Specificații
ISBN-13: 9780130413161
ISBN-10: 013041316X
Pagini: 736
Dimensiuni: 203 x 254 mm
Greutate: 1.51 kg
Ediția:3Nouă
Editura: Pearson Education
Colecția Pearson Education
Locul publicării:Upper Saddle River, United States
ISBN-10: 013041316X
Pagini: 736
Dimensiuni: 203 x 254 mm
Greutate: 1.51 kg
Ediția:3Nouă
Editura: Pearson Education
Colecția Pearson Education
Locul publicării:Upper Saddle River, United States
Cuprins
1. Introduction.
Statistics and the Life Sciences. Examples and Overview.
2. Description of Populations and Samples.
Introduction. Frequency Distributions: Techniques for Data. Frequency Distributions: Shapes and Examples. Descriptive Statistics: Measures of Center. Boxplots. Measures of Dispersion. Effect of Transformation of Variables (Optional). Samples and Populations: Statistical Inference. Perspective.
3. Random Sampling, Probability, and the Binomial Distribution.
Probability and the Life Sciences. Random Sampling. Introduction to Probability. Probability Trees. Probability Rules (Optional). Density Curves. Random Variables. The Binomial Distribution. Fitting a Binomial Distribution to Data (Optional).
4. The Normal Distribution.
Introduction. The Normal Curves. Areas Under a Normal Curve. Assessing Normality. The Continuity Correction (Optional). Perspective.
5. Sampling Distributions.
Basic Ideas. Dichotomous Observations. Quantitative Observations. Illustration of the Central Limit Theorem (Optional). The Normal Approximation to the Binomial Distribution (Optional). Perspective.
6. Confidence Intervals.
Statistical Estimation. Standard Error of the Mean. Confidence Interval. Planning a Study to Estimate. Conditions for Validity of Estimation Methods. Confidence Interval for a Population Proportion. Perspective and Summary.
7. Comparison of Two Independent Samples.
Introduction. Standard Error of (y1 - y2). Confidence Interval. Hypothesis Testing: The t-test. Further Discussion of the t-test. One-Tailed Tests. More on Interpretation of Statistical Significance. Planning for Adequate Power (Optional). Student's t: Conditions and Summary. More on Principles of Testing Hypotheses. The Wilcoxon-Mann-Whitney Test. Perspective.
8. Statistical Principles of Design.
Introduction. Observational Studies. Experiments. Restricted Randomization: Blocking and Stratification. Levels of Replication. Sampling Concerns (Optional). Perspective.
9. Comparison of Paired Samples.
Introduction. The Paired-Sample t-Test and Confidence Interval. The Paired Design. The Sign Test. The Wilcoxon Signed-Rank Test. Further Considerations in Paired Experiments. Perspective.
10. Analysis of Categorical Data.
Inference for Proportions: The Chi-Squared Goodness-of-Fit Test. The Chi-Squared Test for a 2 X 2 Contingency Table. Independence and Association in a 2 X 2 Contingency Table. Fisher's Exact Test (Optional). The r x k Contingency Table. Applicability of Methods. Confidence Interval for a Difference Between Proportions. Paired Data and 2 X 2 Tables (Optional). Relative Risk and the Odds Ratio (Optional). Summary of Chi-Squared Tests.
11. Comparing the Means of Many Independent Samples.
Introduction. The Basic Analysis of Variance. The Analysis of Variance Model (Optional). The Global F-Test. Applicability of Methods. Two-Way ANOVA (Optional). Linear Combinations of Means (Optional). Multiple Comparisons (Optional). Perspective.
12. Linear Regression and Correlation.
Introduction. The Fitted Regression Line. Parametric Interpretation of Regression: The Linear Model. Statistical Inference Concerning B1. The Correlation Coefficient. Guidelines for Interpreting Regression and Correlation. Perspective. Summary of Formulas.
13. A Summary of Inference Methods.
Introduction. Data Analysis Samples.
Appendices.
Chapter Notes.
Statistical Tables.
Answers to Selected Exercises.
Index.
Index of Examples.
Caracteristici
- NEW - New sections throughout—Including sections on probability rules, random variables, the Wilcoxon Signed-Rank Test, and two-way ANOVA and ANOVA for randomized blocks designs.
- Shows students tools for data analysis beyond standard introductory methods.
- Shows students tools for data analysis beyond standard introductory methods.
- NEW - Expanded treatment of logistic regression—Appears in Chapter 12.
- Introduces students to a widely used modeling technique.
- Introduces students to a widely used modeling technique.
- NEW - Approximately 100 new exercises added to the edition—Provides for a total of over 700 exercises in the text.
- Gives students ample opportunity to practice learned concepts.
- Gives students ample opportunity to practice learned concepts.
- Use of real data.
- Provides practical and relevant examples to help students build connection from the concept to the problems.
- Provides practical and relevant examples to help students build connection from the concept to the problems.
- Use of graphical data and analysis.
- Facilitates for students an understanding of statistics and data.
- Facilitates for students an understanding of statistics and data.
- An interpretation of results in context.
- Presents statistics as relevant to students.
- Presents statistics as relevant to students.
- “What to do When” section—Appears in Chapter 13.
- Provides students a summary of methods.
- Provides students a summary of methods.
Caracteristici noi
- New sections throughout—Including sections on probability rules, random variables, the Wilcoxon Signed-Rank Test, and two-way ANOVA and ANOVA for randomized blocks designs.
- Shows students tools for data analysis beyond standard introductory methods.
- Shows students tools for data analysis beyond standard introductory methods.
- Expanded treatment of logistic regression—Appears in Chapter 12.
- Introduces students to a widely used modeling technique.
- Introduces students to a widely used modeling technique.
- Approximately 100 new exercises added to the edition—Provides for a total of over 700 exercises in the text.
- Gives students ample opportunity to practice learned concepts.
- Gives students ample opportunity to practice learned concepts.
