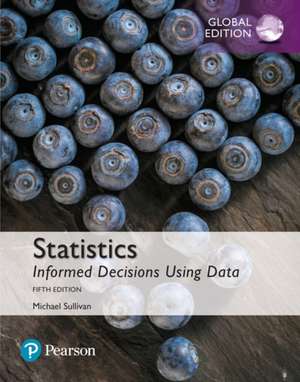
Statistics: Informed Decisions Using Data, Global Edition
Autor Michael Sullivanen Limba Engleză Paperback – 4 iul 2017
Putting It Together
Statistics: Informed Decisions Using Data, Fifth Edition, gives students the tools to see a bigger picture and make informed choices. As a current introductory statistics instructor, Mike Sullivan III presents a text that is filled with ideas and strategies that work in today's classroom. His practical emphasis resonates with students and helps them see that statistics is connected, not only to individual concepts, but also with the world at large.
MyStatLab™ not included. Students, if MyStatLab is a recommended/mandatory component of the course, please ask your instructor for the correct ISBN and course ID. MyStatLab should only be purchased when required by an instructor. Instructors, contact your Pearson representative for more information.
MyStatLab from Pearson is the world's leading online resource for teaching and learning statistics, integrating interactive homework, assessment, and media in a flexible, easy-to-use format. MyStatLab is a course management system that delivers improving results in helping individual students succeed.
MyStatLab for this edition takes advantage of data analytics to add additional exercises to high usage chapters. New Technology Support Videos show the author demonstrating easy-to-follow steps to solve a problem in several different formats?by hand, TI-84, and StatCrunch™.
Preț: 593.97 lei
Preț vechi: 698.80 lei
-15% Nou
Puncte Express: 891
Preț estimativ în valută:
113.65€ • 118.67$ • 93.85£
113.65€ • 118.67$ • 93.85£
Carte disponibilă
Livrare economică 25 martie-08 aprilie
Livrare express 11-15 martie pentru 81.24 lei
Preluare comenzi: 021 569.72.76
Specificații
ISBN-13: 9781292157115
ISBN-10: 1292157119
Pagini: 1016
Dimensiuni: 276 x 217 x 41 mm
Greutate: 2.04 kg
Ediția:5 ed
Editura: Pearson Education
ISBN-10: 1292157119
Pagini: 1016
Dimensiuni: 276 x 217 x 41 mm
Greutate: 2.04 kg
Ediția:5 ed
Editura: Pearson Education
Cuprins
- PART 1: GETTING THE INFORMATION YOU NEED
- 1. Data Collection
- 1.1 Introduction to the Practice of Statistics
- 1.2 Observational Studies versus Designed Experiments
- 1.3 Simple Random Sampling
- 1.4 Other Effective Sampling Methods
- 1.5 Bias in Sampling
- 1.6 The Design of Experiments
- PART 2: DESCRIPTIVE STATISTICS
- 2. Organizing and Summarizing Data
- 2.1 Organizing Qualitative Data
- 2.2 Organizing Quantitative Data: The Popular Displays
- 2.3 Additional Displays of Quantitative Data
- 2.4 Graphical Misrepresentations of Data
- 3. Numerically Summarizing Data
- 3.1 Measures of Central Tendency
- 3.2 Measures of Dispersion
- 3.3 Measures of Central Tendency and Dispersion from Grouped Data
- 3.4 Measures of Position and Outliers
- 3.5 The Five-Number Summary and Boxplots
- 4. Describing the Relation between Two Variables
- 4.1 Scatter Diagrams and Correlation
- 4.2 Least-Squares Regression
- 4.3 Diagnostics on the Least-Squares Regression Line
- 4.4 Contingency Tables and Association
- 4.5 Nonlinear Regression: Transformations (online) 4-1
- PART 3: PROBABILITY AND PROBABILITY DISTRIBUTIONS
- 5. Probability
- 5.1 Probability Rules
- 5.2 The Addition Rule and Complements
- 5.3 Independence and the Multiplication Rule
- 5.4 Conditional Probability and the General Multiplication Rule
- 5.5 Counting Techniques
- 5.6 Putting It Together: Which Method Do I Use?
- 5.7 Bayes's Rule (online) 5-1
- 6. Discrete Probability Distributions
- 6.1 Discrete Random Variables
- 6.2 The Binomial Probability Distribution
- 6.3 The Poisson Probability Distribution
- 6.4 The Hypergeometric Probability Distribution (online) 6-1
- 7. The Normal Probability Distribution
- 7.1 Properties of the Normal Distribution
- 7.2 Applications of the Normal Distribution
- 7.3 Assessing Normality
- 7.4 The Normal Approximation to the Binomial Probability Distribution
- PART 4: INFERENCE: FROM SAMPLES TO POPULATION
- 8. Sampling Distributions
- 8.1 Distribution of the Sample Mean
- 8.2 Distribution of the Sample Proportion
- 9. Estimating the Value of a Parameter
- 9.1 Estimating a Population Proportion
- 9.2 Estimating a Population Mean
- 9.3 Estimating a Population Standard Deviation
- 9.4 Putting It Together: Which Procedure Do I Use?
- 9.5 Estimating with Bootstrapping
- 10. Hypothesis Tests Regarding a Parameter
- 10.1 The Language of Hypothesis Testing
- 10.2 Hypothesis Tests for a Population Proportion
- 10.3 Hypothesis Tests for a Population Mean
- 10.4 Hypothesis Tests for a Population Standard Deviation
- 10.5 Putting It Together: Which Method Do I Use?
- 10.6 The Probability of a Type II Error and the Power of the Test
- 11. Inferences on Two Samples
- 11.1 Inference about Two Population Proportions
- 11.2 Inference about Two Means: Dependent Samples
- 11.3 Inference about Two Means: Independent Samples
- 11.4 Inference about Two Population Standard Deviations
- 11.5 Putting It Together: Which Method Do I Use?
- 12. Inference on Categorical Data
