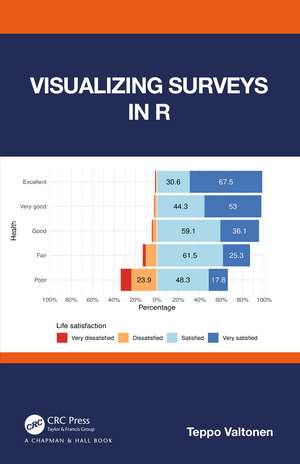
Visualizing Surveys in R
Autor Teppo Valtonenen Limba Engleză Hardback – dec 2023
Features
- Introduction to survey data: variables, categories, and scales
- Description of a process for visualizing survey data
- Recommendations for reading survey data into R
- Advice on building a survey dataset in R to facilitate versatile plotting
- Step-by-step recipes in R for creating useful plots from survey data
Preț: 1040.75 lei
Preț vechi: 1143.68 lei
-9% Nou
Puncte Express: 1561
Preț estimativ în valută:
199.17€ • 205.76$ • 165.76£
199.17€ • 205.76$ • 165.76£
Carte disponibilă
Livrare economică 04-18 martie
Livrare express 15-21 februarie pentru 41.36 lei
Preluare comenzi: 021 569.72.76
Specificații
ISBN-13: 9781032246994
ISBN-10: 1032246995
Pagini: 326
Ilustrații: 18 Tables, black and white; 115 Line drawings, color; 115 Illustrations, color
Dimensiuni: 156 x 234 x 19 mm
Greutate: 0.76 kg
Ediția:1
Editura: CRC Press
Colecția Chapman and Hall/CRC
ISBN-10: 1032246995
Pagini: 326
Ilustrații: 18 Tables, black and white; 115 Line drawings, color; 115 Illustrations, color
Dimensiuni: 156 x 234 x 19 mm
Greutate: 0.76 kg
Ediția:1
Editura: CRC Press
Colecția Chapman and Hall/CRC
Public țintă
Professional TrainingCuprins
I Preparation. 1. Survey data. 2. Process. 3. Variables. 4. Categories. 5. Read data. 6. Parse values. 7. Validate data. 8. Pre-process data. 9. Build a dataset. 10. Basic statistics. 11. Create plots with ggplot2. 12. Save plots to files. 13. R Markdown. II Plotting. 14. Numeric plots. 15. Bar charts. 16. Percentage bars. 17. Diverging percentage bars. 18. Pie charts. 19. Lollipop plots. 20. Dot plots. 21. Heatmaps. 22. Geographic maps. 23. Missing value plots. 24. Validation plots.
Notă biografică
Teppo Valtonen has worked for more than a decade at the Finnish Institute of Occupational on assessing and improving cognitive ergonomics in dozens of organizations of all sizes and from many different industries. His responsibility is to develop and standardize the processes and practices regarding survey implementation and survey data management.
Teppo has graduated as a Master of Science in Technology from the Helsinki University of Tehchnology, today part of the Aalto University, Helsinki, Finland. He is currently a doctoral student at the Aalto University doing research on cognitive demands, productivity and performance at work.
Teppo builds and uses surveys in both research and commercial settings. He has designed questions, scales, surveys and survey forms for research projects, development studies and customer cases. The surveys have produced thousands of observations for hundreds of variables on topics such as cognitive strain, stress, recovery, work engagement, productivity and performance. Typically, Teppo has been responsible for specifying the variables and datasets, managing survey versions, saving the data, validating data and combining data from different survey versions.
Using R, he has created data visualizations for academic and popular reports alike. He has used R to build automatic analysis pipelines and processes for survey data. He has taught R and given advice on using R in various data analysis and management setups.
Descriere
For researchers who use surveys interested in learning how to seize vast possibilities and flexibility of R in survey analysis/visualizations. Psychologists, marketeers, HR personnel, managers, other professionals who wish to standardize/automate the process for visualizing survey data. Suitable for textbook courses.
