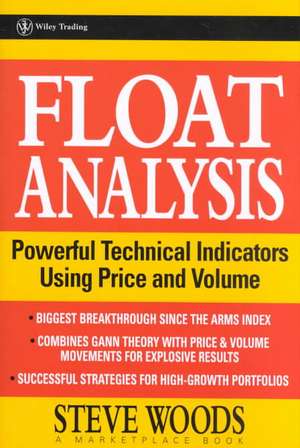
Float Analysis: Powerful Technical Indicators Using Price and Volume: A Marketplace Book
Autor Steve Woodsen Limba Engleză Hardback – 15 mai 2002
Steve Woods(Hyattsville, MD) is the Executive Director of FloatAnalysis.com and has written a number of articles for various journals includingTechnical Analysis of Stocks & Commodities.
New technology and the advent of around the clock trading have opened the floodgates to both foreign and domestic markets. Traders need the wisdom of industry veterans and the vision of innovators in today′s volatile financial marketplace. The Wiley Trading series features books by traders who have survived the market′s ever changing temperament and have prospered–some by reinventing systems, others by getting back to basics. Whether a novice trader, professional or somewhere in–between, these books will provide the advice and strategies needed to prosper today and well into the future.
Preț: 426.95 lei
Preț vechi: 464.08 lei
-8% Nou
Puncte Express: 640
Preț estimativ în valută:
81.69€ • 85.53$ • 67.60£
81.69€ • 85.53$ • 67.60£
Carte tipărită la comandă
Livrare economică 01-07 aprilie
Preluare comenzi: 021 569.72.76
Specificații
ISBN-13: 9780471215530
ISBN-10: 0471215538
Pagini: 232
Dimensiuni: 166 x 243 x 21 mm
Greutate: 0.48 kg
Ediția:Revised & Updat.
Editura: Wiley
Seria A Marketplace Book
Locul publicării:Hoboken, United States
ISBN-10: 0471215538
Pagini: 232
Dimensiuni: 166 x 243 x 21 mm
Greutate: 0.48 kg
Ediția:Revised & Updat.
Editura: Wiley
Seria A Marketplace Book
Locul publicării:Hoboken, United States
Public țintă
Traders; individual and professionalDescriere
∗
Biggest
Breakthrough
since
the
ARMS
index
∗ Combines Gann theory with Price & Volume movements for explosive results
∗ Successful strategies for high–growth portfolios
Float Analysis
Powerful Technical Indicators Using Price and Volume
"Float Analysis is an innovative indicator that all serious traders will want to familiarize themselves with to help determine the most effective buy and sell points for specific trades."
–Martin Pring
author of Martin Pring′s Introduction to Technical Analysis
"[Steve Woods] has done a tremendous job of investigating and describing this new area of technical analysis and I highly recommend adding it to your arsenal of trading indicators."
–Larry McMillan
author of McMillan on Options
Float Analysis: Powerful Technical Indicators Using Price and Volume introduces a powerful new indicator that will revolutionize the way you trade. Pushing the boundaries of technical analysis, active trader Steve Woods combines price and volume charts with the knowledge of available shares in the market, or float, to form a strongly predictive indicator–his very own Woods Cumulative–Volume Float Indicator–that can target winning stocks with incredible accuracy.
Even the experts agree that every trader can now discover the power of this exciting new indicator–and trading theory–by reading this comprehensive new book. Take this chance to master float analysis and watch your profits soar.
Textul de pe ultima copertă
∗
Biggest
Breakthrough
since
the
ARMS
index
∗ Combines Gann theory with Price & Volume movements for explosive results
∗ Successful strategies for high–growth portfolios
Float Analysis
Powerful Technical Indicators Using Price and Volume
"Float Analysis is an innovative indicator that all serious traders will want to familiarize themselves with to help determine the most effective buy and sell points for specific trades."
–Martin Pring
author of Martin Pring′s Introduction to Technical Analysis
"[Steve Woods] has done a tremendous job of investigating and describing this new area of technical analysis and I highly recommend adding it to your arsenal of trading indicators."
–Larry McMillan
author of McMillan on Options
Float Analysis: Powerful Technical Indicators Using Price and Volume introduces a powerful new indicator that will revolutionize the way you trade. Pushing the boundaries of technical analysis, active trader Steve Woods combines price and volume charts with the knowledge of available shares in the market, or float, to form a strongly predictive indicator–his very own Woods Cumulative–Volume Float Indicator–that can target winning stocks with incredible accuracy.
Even the experts agree that every trader can now discover the power of this exciting new indicator–and trading theory–by reading this comprehensive new book. Take this chance to master float analysis and watch your profits soar.
∗ Combines Gann theory with Price & Volume movements for explosive results
∗ Successful strategies for high–growth portfolios
Float Analysis
Powerful Technical Indicators Using Price and Volume
"Float Analysis is an innovative indicator that all serious traders will want to familiarize themselves with to help determine the most effective buy and sell points for specific trades."
–Martin Pring
author of Martin Pring′s Introduction to Technical Analysis
"[Steve Woods] has done a tremendous job of investigating and describing this new area of technical analysis and I highly recommend adding it to your arsenal of trading indicators."
–Larry McMillan
author of McMillan on Options
Float Analysis: Powerful Technical Indicators Using Price and Volume introduces a powerful new indicator that will revolutionize the way you trade. Pushing the boundaries of technical analysis, active trader Steve Woods combines price and volume charts with the knowledge of available shares in the market, or float, to form a strongly predictive indicator–his very own Woods Cumulative–Volume Float Indicator–that can target winning stocks with incredible accuracy.
Even the experts agree that every trader can now discover the power of this exciting new indicator–and trading theory–by reading this comprehensive new book. Take this chance to master float analysis and watch your profits soar.
Cuprins
Acknowledgments.
Introduction –W. D. Gann: The Inspiration for Float Analysis.
CHAPTER ONE –Watching the Float: The New Look of Price and Volume Charts and Their Relationship to a Stock′s Future Price Direction.
The Float.
A Float Turnover.
The First Discovery.
Scenario One –The Smart Money and the Losing Money.
Scenario Two –The Yin and Yang of Float Analysis.
The Importance of the Discovery of Float Turnovers at Bottoms and Tops.
In Search of a Breakout Buy Point: A Case History of Xicor.
A Simple Random Sample Experiment.
CHAPTER TWO–Ten Breakthrough Discoveries That Will Change the Way You Analyze Stock Charts.
The Multiple Float Turnover Formation.
The Bottom Formation and the Top Formation.
The Base of Support within a Correction Formation.
The Strong Sideways Base of Support in an Up–Trend Formation.
The Overhead Base of Support Formation.
The Slow Extension Formation.
The Fast Extension Formation.
The Upright Flag Formation.
The Inverted Flag Formation.
The Weak Base of Support Formation.
CHAPTER THREE–Technicals 101: How to Understand–and Profit from–the Indicators.
The Cumulative–Volume Float Indicators.
The Common Characteristics of Float Turnovers.
CHAPTER FOUR–Support and Resistance Redefined: Creating a Model of Stock Behavior That Brings Results.
The Rising Base of Support.
The Descending Ceiling of Resistance.
The Changing Nature of Float Turnovers from Support to Resistance, and Vice Versa.
Unique Points of Support and Resistance in Up–Trends and Down–Trends.
Support and Resistance in Multiple Turnover Sideways Bases.
Valid Breakouts.
A Strategic Challenge.
CHAPTER FIVE –Successful Strategies That Made My Stock Portfolio Grow Tenfold in Sixteen Months.
The Mirror Image Dilemma and Its Solutions.
Playing the Upside.
Playing the Downside.
Final Strategies.
Summary.
Appendix A–A Compendium of Float Analysis Formations.
Appendix B–The Dilemma of Differing Results Resolved.
Bibliography.
Glossary.
Trading Resource Guide–Tools for Success in Trading.
Suggested Reading List.
Internet Sites.
Newsletters of Interest to Traders.
Index.
Notă biografică
STEVE
WOODS
is
the
Executive
Director
of
FloatAnalysis.com,
a
stock
analysis
and
software
business
that
services
clients
around
the
world.
The
inventor
of
the
Woods
Cumulative–Volume
Float
Indicator,
Woods
has
written
a
number
of
articles
for
various
trade
journals
including
Technical
Analysis
of
Stocks
&
Commodities
magazine.
Mr.
Woods
is
an
avid
trader.


