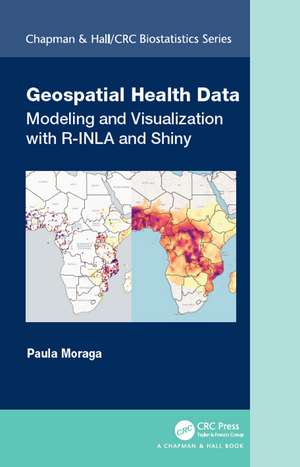
Geospatial Health Data: Modeling and Visualization with R-INLA and Shiny: Chapman & Hall/CRC Biostatistics Series
Autor Paula Moragaen Limba Engleză Hardback – 25 noi 2019
- Manipulating and transforming point, areal, and raster data,
- Bayesian hierarchical models for disease mapping using areal and geostatistical data,
- Fitting and interpreting spatial and spatio-temporal models with the integrated nested Laplace approximation (INLA) and the stochastic partial differential equation (SPDE) approaches,
- Creating interactive and static visualizations such as disease maps and time plots,
- Reproducible R Markdown reports, interactive dashboards, and Shiny web applications that facilitate the communication of insights to collaborators and policymakers.
Din seria Chapman & Hall/CRC Biostatistics Series
-
 Preț: 386.63 lei
 - 5%
 Preț: 338.18 lei
 - 5%
 Preț: 656.97 lei
 -
 Preț: 341.43 lei
 -
 Preț: 355.92 lei
 - 8%
 Preț: 432.16 lei
 -
 Preț: 354.78 lei
 -
 Preț: 342.90 lei
 -
 Preț: 288.81 lei
 -
 Preț: 312.36 lei
 - 9%
 Preț: 644.58 lei
 - 8%
 Preț: 376.64 lei
 -
 Preț: 372.30 lei
 -
 Preț: 356.64 lei
 - 8%
 Preț: 531.51 lei
 - 9%
 Preț: 608.33 lei
 - 9%
 Preț: 766.28 lei
 -
 Preț: 378.12 lei
 -
 Preț: 356.64 lei
 - 9%
 Preț: 682.94 lei
 - 9%
 Preț: 594.80 lei
 -
 Preț: 311.47 lei
 -
 Preț: 362.08 lei
 - 9%
 Preț: 833.75 lei
 - 9%
 Preț: 683.12 lei
 - 9%
 Preț: 681.83 lei
 -
 Preț: 370.53 lei
 - 9%
 Preț: 940.39 lei
 - 18%
 Preț: 791.14 lei
 - 18%
 Preț: 702.37 lei
 - 18%
 Preț: 1730.31 lei
 - 28%
 Preț: 875.16 lei
 - 18%
 Preț: 786.89 lei
 - 25%
 Preț: 825.63 lei
 - 15%
 Preț: 678.14 lei
 - 25%
 Preț: 557.58 lei
 - 29%
 Preț: 625.83 lei
 - 18%
 Preț: 786.38 lei
 - 25%
 Preț: 778.07 lei
 - 25%
 Preț: 628.29 lei
 - 18%
 Preț: 1124.97 lei
 - 28%
 Preț: 881.75 lei
 - 25%
 Preț: 526.81 lei
 - 18%
 Preț: 797.46 lei
 - 15%
 Preț: 479.86 lei
 - 18%
 Preț: 1017.63 lei
Preț: 499.81 lei
Preț vechi: 667.30 lei
-25% Nou
Puncte Express: 750
Preț estimativ în valută:
95.67€ • 103.95$ • 80.41£
95.67€ • 103.95$ • 80.41£
Carte tipărită la comandă
Livrare economică 21 aprilie-05 mai
Preluare comenzi: 021 569.72.76
Specificații
ISBN-13: 9780367357955
ISBN-10: 036735795X
Pagini: 294
Dimensiuni: 156 x 234 x 17 mm
Greutate: 0.61 kg
Ediția:1
Editura: CRC Press
Colecția Chapman and Hall/CRC
Seria Chapman & Hall/CRC Biostatistics Series
ISBN-10: 036735795X
Pagini: 294
Dimensiuni: 156 x 234 x 17 mm
Greutate: 0.61 kg
Ediția:1
Editura: CRC Press
Colecția Chapman and Hall/CRC
Seria Chapman & Hall/CRC Biostatistics Series
Public țintă
Postgraduate and ProfessionalCuprins
1. Geospatial health. 2. Spatial data and R packages for mapping. 3. Bayesian inference and INLA. 4. The R-INLA package. 5. Areal data. 6. Spatial modeling of areal data. 7. Spatio-temporal modeling of areal data. 8. Geostatistical data. 9. Spatial modeling of geostatistical data. 10. Spatio-temporal modeling of geostatistical data. 11. Introduction to R Markdown. 12. Building a dashboard to visualize spatial data with flexdashboard. 13. Introduction to Shiny. 14. Interactive dashboards with flexdashboard and Shiny. 15. Building a Shiny app to upload and visualize spatio-temporal data. 16. Disease surveillance with SpatialEpiApp.
Notă biografică
Paula Moraga is a Lecturer in the Department of Mathematical Sciences at the University of Bath. She received her Master’s in Biostatistics from Harvard University and her Ph.D. in Statistics from the University of Valencia. Dr. Moraga develops innovative statistical methods and open-source software for disease surveillance including R packages for spatio-temporal modeling, detection of clusters, and travel-related spread of disease. Her work has directly informed strategic policy in reducing the burden of diseases such as malaria and cancer in several countries.
Recenzii
"The stress is on practical usage of INLA modelling in a spatial context and hence the author shows the full code for several carefully selected examples. Essentially all the steps from the beginning (necessary data manipulation and preparation) via INLA analysis itself (often in several alternatives) to the results (plots and maps) are explained carefully and commented. This is very useful for anybody who wants to start with the powerful INLA but did not dare to go through the very powerful but notalways- fully-documented environment." ~Marek Brabec, ISCB News
Descriere
This book shows how to model disease risk and quantify risk factors using areal and geostatistical data. It also shows how to create interactive maps of disease risk and risk factors, and describes how to build interactive dashboards and Shiny web applications that facilitate the communication of insights to collaborators and policy makers.
