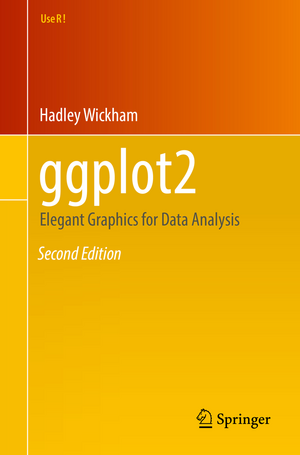
ggplot2: Elegant Graphics for Data Analysis: Use R!
Autor Hadley Wickhamen Limba Engleză Paperback – 16 iun 2016
- produce handsome, publication-quality plots with automatic legends created from the plot specification
- superimpose multiple layers (points, lines, maps, tiles, box plots) from different data sources with automatically adjusted common scales
- add customizable smoothers that use powerful modeling capabilities of R, such as loess, linear models, generalized additive models, and robust regression
- save any ggplot2 plot (or part thereof) for later modification or reuse
- create custom themes that capture in-house or journal style requirements and that can easily be applied to multiple plots
- approach a graph from a visual perspective, thinking about how eachcomponent of the data is represented on the final plot
Din seria Use R!
- 15%
 Preț: 676.86 lei
 - 17%
 Preț: 362.74 lei
 - 15%
 Preț: 591.79 lei
 - 17%
 Preț: 362.15 lei
 - 17%
 Preț: 461.36 lei
 -
 Preț: 226.73 lei
 - 17%
 Preț: 395.94 lei
 -
 Preț: 374.86 lei
 - 20%
 Preț: 500.66 lei
 - 17%
 Preț: 396.92 lei
 - 15%
 Preț: 360.58 lei
 - 17%
 Preț: 430.21 lei
 -
 Preț: 276.09 lei
 - 15%
 Preț: 497.12 lei
 - 15%
 Preț: 471.53 lei
 - 15%
 Preț: 525.35 lei
 -
 Preț: 489.30 lei
 - 15%
 Preț: 523.07 lei
 -
 Preț: 455.89 lei
 - 15%
 Preț: 518.73 lei
 - 18%
 Preț: 835.24 lei
 - 15%
 Preț: 498.94 lei
 - 18%
 Preț: 783.35 lei
 - 18%
 Preț: 783.20 lei
 - 15%
 Preț: 523.91 lei
 -
 Preț: 484.47 lei
 - 15%
 Preț: 523.07 lei
 -
 Preț: 419.06 lei
 - 15%
 Preț: 695.70 lei
 - 15%
 Preț: 499.12 lei
 - 15%
 Preț: 493.89 lei
 - 15%
 Preț: 584.10 lei
 - 15%
 Preț: 591.47 lei
 - 15%
 Preț: 497.31 lei
 - 15%
 Preț: 696.02 lei
 -
 Preț: 420.02 lei
 -
 Preț: 489.87 lei
 - 15%
 Preț: 579.66 lei
 -
 Preț: 486.42 lei
 - 15%
 Preț: 507.95 lei
 -
 Preț: 388.34 lei
 - 15%
 Preț: 496.67 lei
 -
 Preț: 423.47 lei
 - 15%
 Preț: 520.61 lei
 - 15%
 Preț: 531.26 lei
 - 15%
 Preț: 576.52 lei
 -
 Preț: 454.16 lei
Preț: 420.40 lei
Nou
Puncte Express: 631
Preț estimativ în valută:
80.44€ • 83.99$ • 66.58£
80.44€ • 83.99$ • 66.58£
Carte tipărită la comandă
Livrare economică 04-18 aprilie
Preluare comenzi: 021 569.72.76
Specificații
ISBN-13: 9783319242750
ISBN-10: 331924275X
Pagini: 259
Ilustrații: XVI, 260 p. 232 illus., 140 illus. in color.
Dimensiuni: 155 x 235 x 20 mm
Greutate: 0.4 kg
Ediția:2nd ed. 2016
Editura: Springer International Publishing
Colecția Springer
Seria Use R!
Locul publicării:Cham, Switzerland
ISBN-10: 331924275X
Pagini: 259
Ilustrații: XVI, 260 p. 232 illus., 140 illus. in color.
Dimensiuni: 155 x 235 x 20 mm
Greutate: 0.4 kg
Ediția:2nd ed. 2016
Editura: Springer International Publishing
Colecția Springer
Seria Use R!
Locul publicării:Cham, Switzerland
Public țintă
Professional/practitionerCuprins
Introduction.- Getting Started with ggplot2.- Toolbox.- Mastering the Grammar.- Building a Plot Layer by Layer.- Scales, Axes and Legends.- Positioning.- Themes.- Data Analysis.- Data Transformation.- Modelling for Visualisation.- Programming with ggplot2.- Index.- R Code Index.
Recenzii
“The versatility and efficiency of ggplot have led to the development of ggplot2 and this book which overviews the standard use and presentation secrets of functions developed in the last 5 years. … The book is written in an accessible manner and it is suitable for undergraduates, postgraduates and researchers with some R experience. All theoretical concepts are accompanied by code making it easy to learn by reproducing the examples.” (Irina Ioana Mohorianu, zbMATH 1397.62006, 2018)
Notă biografică
Hadley Wickham is Chief Scientist at RStudio and Assistant Professor of Statistics at Rice University. Hadley is interested in developing computational and cognitive tools for making data preparation, visualization, and analysis easier. He has developed 15 R packages and in 2006 won the John Chambers Award for Statistical Computing for his work on the ggplot and reshape R packages.
Carson Sievert is a PhD student in the Department of Statistics at Iowa State University. His work includes R packages for acquiring data from the Web (pitchRx, bbscrapeR, XML2R), designing interactive Web graphics (animint, plotly), and visualizations for exploring statistical models (LDAvis).
Textul de pe ultima copertă
This new edition to the classic book by ggplot2 creator Hadley Wickham highlights compatibility with knitr and RStudio. ggplot2 is a data visualization package for R that helps users create data graphics, including those that are multi-layered, with ease. With ggplot2, it's easy to:
•produce handsome, publication-quality plots with automatic legends created from the plot specification
•superimpose multiple layers (points, lines, maps, tiles, box plots) from different data sources with automatically adjusted common scales
•add customizable smoothers that use powerful modeling capabilities of R, such as loess, linear models, generalized additive models, and robust regression
• save any ggplot2 plot (or part thereof) for later modification or reuse
•create custom themes that capture in-house or journal style requirements and that can easily be appliedto multiple plots
•approach a graph from a visual perspective, thinking about how each component of the data is represented on the final plot
This book will be useful to everyone who has struggled with displaying data in an informative and attractive way. Some basic knowledge of R is necessary (e.g., importing data into R). ggplot2 is a mini-language specifically tailored for producing graphics, and you'll learn everything you need in the book. After reading this book you'll be able to produce graphics customized precisely for your problems, and you'll find it easy to get graphics out of your head and on to the screen or page. New to this edition:<
•Brings the book up-to-date with ggplot2 1.0, including major updates to the theme system
•New scales, stats and geoms added throughout
•Additional practice exercises
•A revisedintroduction that focuses on ggplot() instead of qplot()
•Updated chapters on data and modeling using tidyr, dplyr and broom
Caracteristici
Brings the book up-to-date with ggplot2 1.0, including major updates to the theme system New scales, stats and geoms added throughout Additional practice exercises A revised introduction that focuses on ggplot() instead of qplot() Updated chapters on data and modeling using tidyr, dplyr and broom
