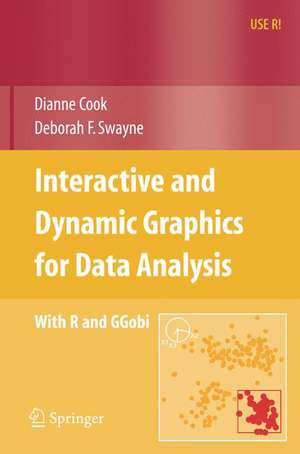
Interactive and Dynamic Graphics for Data Analysis: With R and GGobi: Use R!
Autor Dianne Cook Contribuţii de A. Buja Autor Deborah F. Swayne Contribuţii de D. Temple Lang, H. Hofmann, H. Wickham, M. Lawrenceen Limba Engleză Paperback – 12 dec 2007
Din seria Use R!
- 15%
 Preț: 676.86 lei
 - 17%
 Preț: 362.75 lei
 - 15%
 Preț: 591.79 lei
 - 17%
 Preț: 362.16 lei
 - 17%
 Preț: 461.37 lei
 -
 Preț: 226.74 lei
 - 17%
 Preț: 395.94 lei
 -
 Preț: 374.87 lei
 - 20%
 Preț: 500.66 lei
 - 17%
 Preț: 396.92 lei
 - 15%
 Preț: 360.59 lei
 - 17%
 Preț: 430.21 lei
 -
 Preț: 276.09 lei
 - 15%
 Preț: 497.12 lei
 - 15%
 Preț: 471.53 lei
 - 15%
 Preț: 525.35 lei
 -
 Preț: 489.30 lei
 - 15%
 Preț: 523.07 lei
 -
 Preț: 455.89 lei
 - 15%
 Preț: 518.73 lei
 - 18%
 Preț: 835.24 lei
 - 15%
 Preț: 498.94 lei
 - 18%
 Preț: 783.35 lei
 - 18%
 Preț: 783.20 lei
 - 15%
 Preț: 523.91 lei
 -
 Preț: 484.47 lei
 -
 Preț: 420.40 lei
 - 15%
 Preț: 523.07 lei
 -
 Preț: 419.06 lei
 - 15%
 Preț: 695.70 lei
 - 15%
 Preț: 499.12 lei
 - 15%
 Preț: 493.89 lei
 - 15%
 Preț: 584.10 lei
 - 15%
 Preț: 591.47 lei
 - 15%
 Preț: 497.31 lei
 - 15%
 Preț: 696.02 lei
 -
 Preț: 420.02 lei
 -
 Preț: 489.87 lei
 - 15%
 Preț: 579.66 lei
 -
 Preț: 486.42 lei
 - 15%
 Preț: 507.95 lei
 - 15%
 Preț: 496.67 lei
 -
 Preț: 423.47 lei
 - 15%
 Preț: 520.61 lei
 - 15%
 Preț: 531.26 lei
 - 15%
 Preț: 576.52 lei
 -
 Preț: 454.16 lei
Preț: 388.34 lei
Nou
Puncte Express: 583
Preț estimativ în valută:
74.32€ • 80.70$ • 62.43£
74.32€ • 80.70$ • 62.43£
Carte tipărită la comandă
Livrare economică 22 aprilie-06 mai
Preluare comenzi: 021 569.72.76
Specificații
ISBN-13: 9780387717616
ISBN-10: 0387717617
Pagini: 188
Ilustrații: XVIII, 188 p.
Dimensiuni: 155 x 235 x 11 mm
Greutate: 0.42 kg
Ediția:2007
Editura: Springer
Colecția Springer
Seria Use R!
Locul publicării:New York, NY, United States
ISBN-10: 0387717617
Pagini: 188
Ilustrații: XVIII, 188 p.
Dimensiuni: 155 x 235 x 11 mm
Greutate: 0.42 kg
Ediția:2007
Editura: Springer
Colecția Springer
Seria Use R!
Locul publicării:New York, NY, United States
Public țintă
ResearchCuprins
TheToolbox.- Missing Values.- Supervised Classification.- Cluster Analysis.- Miscellaneous Topics.- Datasets.
Recenzii
From the reviews:
"The central theme of the book is multivariate data visualization. The focus is on interactive and dynamic graphics.… The target audience of the book is (advanced) undergraduate and graduate students, but also industrial statisticians, engineers, bioinformaticists, and computer scientists.… Each chapter ends with some exercises. The chapters are well written and structured, and the examples are well documented.… A reader with a decent knowledge of multivariate statistics … will be happy with this book." (Ruud H. Koning, Kwantitatieve Methoden, 2008R14)
"In this book, R commands are used to exploit the power of the GGobi systems for interactive and dynamic graphics.…This book, … is a very useful brief overview of the insight that a powerful modern suite of graphics tools may offer." (John Maindonald, International Statistical Review, 2008, 76, 3, pages 436-437)
"Diane Cook and Deborah Swayne’s new book, part of Springer’s Use R! series, helps fill an important niche in the literature for the R community and readers of Biometrics. The title of the book indicates the substantial challenge: the book is neither purely methodological nor simply about software. It draws upon the expertise of a wide range of contributors.… I will borrow a phrase the authors use on the opening page: these resources help us "orient ourselves in the sea of information."" (Biometrics 2008)
"The book describes the use of interactive and dynamic graphics as part of multidimensional data analysis. … The book may be used as a text in a class on statistical graphics, exploratory data analysis, visual data mining, or information visualisation. It might also be used as an adjunct text in a course on multivariate data analysis or data mining. Moreover, the book is suitable for an industrial statistician, engineer, bioinformaticist, or computer scientist … . Finally, it may be useful to amathematician … ." (Christina Diakaki, Zentralblatt MATH, Vol. 1154, 2009)
Textul de pe ultima copertă
This richly illustrated book describes the use of interactive and dynamic graphics as part of multidimensional data analysis. Chapters include clustering, supervised classification, and working with missing values. A variety of plots and interaction methods are used in each analysis, often starting with brushing linked low-dimensional views and working up to manual manipulation of tours of several variables. The role of graphical methods is shown at each step of the analysis, not only in the early exploratory phase, but in the later stages, too, when comparing and evaluating models.
All examples are based on freely available software: GGobi for interactive graphics and R for static graphics, modeling, and programming. The printed book is augmented by a wealth of material on the web, encouraging readers follow the examples themselves. The web site has all the data and code necessary to reproduce the analyses in the book, along with movies demonstrating the examples.
The book may be used as a text in a class on statistical graphics or exploratory data analysis, for example, or as a guide for the independent learner. Each chapter ends with a set of exercises.
The authors are both Fellows of the American Statistical Association, past chairs of the Section on Statistical Graphics, and co-authors of the GGobi software. Dianne Cook is Professor of Statistics at Iowa State University. Deborah Swayne is a member of the Statistics Research Department at AT&T Labs.
Caracteristici
The book's examples use the software R and GGobi Illustrated examples, supplemented by movies on the web, help he reader learn how to use interactive graphics for data anlaysis Full color figures illuminate high-dimensional data spaces Everything in the book can be replicated by the reader with free software Request lecturer material: sn.pub/lecturer-material
