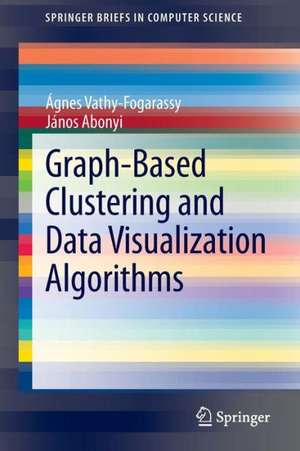
Graph-Based Clustering and Data Visualization Algorithms: SpringerBriefs in Computer Science
Autor Ágnes Vathy-Fogarassy, János Abonyien Limba Engleză Paperback – 5 iun 2013
Din seria SpringerBriefs in Computer Science
-
 Preț: 475.83 lei
 - 20%
 Preț: 166.97 lei
 - 20%
 Preț: 325.63 lei
 - 20%
 Preț: 349.13 lei
 - 20%
 Preț: 302.48 lei
 -
 Preț: 381.81 lei
 -
 Preț: 446.47 lei
 - 20%
 Preț: 296.17 lei
 - 20%
 Preț: 335.65 lei
 - 20%
 Preț: 463.83 lei
 - 20%
 Preț: 323.00 lei
 - 20%
 Preț: 322.35 lei
 - 20%
 Preț: 321.85 lei
 - 20%
 Preț: 232.68 lei
 -
 Preț: 375.45 lei
 - 20%
 Preț: 323.00 lei
 - 20%
 Preț: 322.81 lei
 - 20%
 Preț: 324.17 lei
 - 20%
 Preț: 323.00 lei
 - 20%
 Preț: 322.17 lei
 - 20%
 Preț: 322.50 lei
 - 20%
 Preț: 323.34 lei
 - 20%
 Preț: 324.17 lei
 - 20%
 Preț: 323.46 lei
 - 20%
 Preț: 322.17 lei
 - 20%
 Preț: 322.02 lei
 -
 Preț: 341.50 lei
 - 20%
 Preț: 324.49 lei
 -
 Preț: 344.47 lei
 -
 Preț: 376.80 lei
 -
 Preț: 377.18 lei
 - 20%
 Preț: 324.17 lei
 - 20%
 Preț: 352.26 lei
 - 20%
 Preț: 321.32 lei
 - 20%
 Preț: 322.17 lei
 - 20%
 Preț: 324.17 lei
 - 20%
 Preț: 322.02 lei
 -
 Preț: 374.46 lei
 - 20%
 Preț: 320.21 lei
 - 20%
 Preț: 323.34 lei
 - 20%
 Preț: 324.17 lei
 - 20%
 Preț: 231.84 lei
 - 20%
 Preț: 294.95 lei
 - 20%
 Preț: 322.50 lei
 - 20%
 Preț: 323.46 lei
 -
 Preț: 374.08 lei
 -
 Preț: 408.23 lei
 - 20%
 Preț: 321.52 lei
 - 20%
 Preț: 323.34 lei
 - 20%
 Preț: 323.00 lei
Preț: 381.55 lei
Preț vechi: 476.94 lei
-20% Nou
Puncte Express: 572
Preț estimativ în valută:
73.01€ • 76.23$ • 60.42£
73.01€ • 76.23$ • 60.42£
Carte tipărită la comandă
Livrare economică 04-18 aprilie
Preluare comenzi: 021 569.72.76
Specificații
ISBN-13: 9781447151579
ISBN-10: 1447151577
Pagini: 124
Ilustrații: XIII, 110 p. 62 illus.
Dimensiuni: 155 x 235 x 7 mm
Greutate: 0.2 kg
Ediția:2013
Editura: SPRINGER LONDON
Colecția Springer
Seria SpringerBriefs in Computer Science
Locul publicării:London, United Kingdom
ISBN-10: 1447151577
Pagini: 124
Ilustrații: XIII, 110 p. 62 illus.
Dimensiuni: 155 x 235 x 7 mm
Greutate: 0.2 kg
Ediția:2013
Editura: SPRINGER LONDON
Colecția Springer
Seria SpringerBriefs in Computer Science
Locul publicării:London, United Kingdom
Public țintă
ResearchCuprins
Vector Quantisation and Topology-Based Graph Representation.- Graph-Based Clustering Algorithms.- Graph-Based Visualisation of High-Dimensional Data.
Textul de pe ultima copertă
This work presents a data visualization technique that combines graph-based topology representation and dimensionality reduction methods to visualize the intrinsic data structure in a low-dimensional vector space. The application of graphs in clustering and visualization has several advantages. A graph of important edges (where edges characterize relations and weights represent similarities or distances) provides a compact representation of the entire complex data set. This text describes clustering and visualization methods that are able to utilize information hidden in these graphs, based on the synergistic combination of clustering, graph-theory, neural networks, data visualization, dimensionality reduction, fuzzy methods, and topology learning. The work contains numerous examples to aid in the understanding and implementation of the proposed algorithms, supported by a MATLAB toolbox available at an associated website.
Caracteristici
Examines vector quantization methods, and discusses the advantages and disadvantages of minimal spanning tree-based clustering Presents a novel similarity measure to improve the classical Jarvis-Patrick clustering algorithm Reviews distance-, neighborhood- and topology-based dimensionality reduction methods, and introduces new graph-based visualization algorithms
