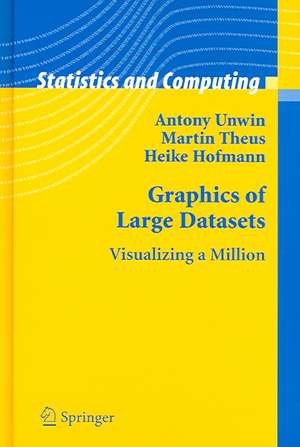
Graphics of Large Datasets: Visualizing a Million: Statistics and Computing
Autor Antony Unwin, Martin Theus, Heike Hofmannen Limba Engleză Hardback – 24 iul 2006
New approaches to graphics are needed to visualize the information in large datasets and most of the innovations described in this book are developments of standard graphics. There are considerable advantages in extending displays which are well-known and well-tried, both in understanding how best to make use of them in your work and in presenting results to others. It should also make the book readily accessible for readers who already have a little experience of drawing statistical graphics. All ideas are illustrated with displays from analyses of real datasets and the authors emphasize the importance of interpreting displays effectively. Graphics should be drawn to convey information and the book includes many insightful examples.
From the reviews:
"Anyone interested in modern techniques for visualizing data will be well rewarded by reading this book. There is a wealth of important plotting types and techniques." Paul Murrell for the Journal of Statistical Software, December 2006
"This fascinating book looks at the question of visualizing large datasets from many different perspectives. Different authors are responsible for different chapters and this approach works well in giving the reader alternative viewpoints of the same problem. Interestingly the authors havecleverly chosen a definition of 'large dataset'. Essentially they focus on datasets with the order of a million cases. As the authors point out there are now many examples of much larger datasets but by limiting to ones that can be loaded in their entirety in standard statistical software they end up with a book that has great utility to the practitioner rather than just the theorist. Another very attractive feature of the book is the many colour plates, showing clearly what can now routinely be seen on the computer screen. The interactive nature of data analysis with large datasets is hard to reproduce in a book but the authors make an excellent attempt to do just this." P. Marriott for the Short Book Reviews of the ISI
| Toate formatele și edițiile | Preț | Express |
|---|---|---|
| Paperback (1) | 474.37 lei 6-8 săpt. | |
| Springer – 23 aug 2016 | 474.37 lei 6-8 săpt. | |
| Hardback (1) | 655.20 lei 6-8 săpt. | |
| Springer – 24 iul 2006 | 655.20 lei 6-8 săpt. |
Din seria Statistics and Computing
-
 Preț: 228.21 lei
 -
 Preț: 438.82 lei
 -
 Preț: 386.81 lei
 - 20%
 Preț: 753.97 lei
 - 20%
 Preț: 1059.77 lei
 -
 Preț: 426.72 lei
 - 20%
 Preț: 474.37 lei
 - 18%
 Preț: 1387.07 lei
 -
 Preț: 433.53 lei
 -
 Preț: 208.58 lei
 - 20%
 Preț: 1454.73 lei
 -
 Preț: 377.18 lei
 - 23%
 Preț: 652.30 lei
 - 20%
 Preț: 1174.26 lei
 - 20%
 Preț: 505.19 lei
 - 18%
 Preț: 959.32 lei
 - 15%
 Preț: 643.48 lei
 -
 Preț: 392.75 lei
 - 15%
 Preț: 640.06 lei
 -
 Preț: 404.29 lei
 - 15%
 Preț: 710.42 lei
 - 15%
 Preț: 695.85 lei
 - 20%
 Preț: 1276.86 lei
 - 18%
 Preț: 1003.38 lei
 - 15%
 Preț: 703.85 lei
 -
 Preț: 384.70 lei
 - 15%
 Preț: 606.17 lei
 - 15%
 Preț: 646.94 lei
 - 15%
 Preț: 589.02 lei
 - 18%
 Preț: 1117.99 lei
 -
 Preț: 503.52 lei
 - 18%
 Preț: 735.38 lei
 - 15%
 Preț: 693.90 lei
Preț: 655.20 lei
Preț vechi: 819.00 lei
-20% Nou
Puncte Express: 983
Preț estimativ în valută:
125.37€ • 130.90$ • 103.76£
125.37€ • 130.90$ • 103.76£
Carte tipărită la comandă
Livrare economică 05-19 aprilie
Preluare comenzi: 021 569.72.76
Specificații
ISBN-13: 9780387329062
ISBN-10: 0387329064
Pagini: 271
Ilustrații: XIII, 271 p.
Dimensiuni: 155 x 235 x 19 mm
Greutate: 0.69 kg
Ediția:2006
Editura: Springer
Colecția Springer
Seria Statistics and Computing
Locul publicării:New York, NY, United States
ISBN-10: 0387329064
Pagini: 271
Ilustrații: XIII, 271 p.
Dimensiuni: 155 x 235 x 19 mm
Greutate: 0.69 kg
Ediția:2006
Editura: Springer
Colecția Springer
Seria Statistics and Computing
Locul publicării:New York, NY, United States
Public țintă
ResearchCuprins
Basics.- Statistical Graphics.- Scaling Up Graphics.- Interacting with Graphics.- Applications.- Multivariate Categorical Data — Mosaic Plots.- Rotating Plots.- Multivariate Continuous Data — Parallel Coordinates.- Networks.- Trees.- Transactions.- Graphics of a Large Dataset.
Recenzii
From the reviews:
"Anyone interested in modern techniques for visualizing data will be well rewarded by reading this book. There is a wealth of important plotting types and techniques." Paul Murrell for the Journal of Statistical Software, December 2006
"This fascinating book looks at the question of visualizing large datasets from many different perspectives. Different authors are responsible for different chapters and this approach works well in giving the reader alternative viewpoints of the same problem. Interestingly the authors have cleverly chosen a definition of 'large dataset'. Essentially they focus on datasets with the order of a million cases. As the authors point out there are now many examples of much larger datasets but by limiting to ones that can be loaded in their entirety in standard statistical software they end up with a book that has great utility to the practitioner rather than just the theorist. Another very attractive feature of the book is the many colour plates, showing clearly what can now routinely be seen on the computer screen. The interactive nature of data analysis with large datasets is hard to reproduce in a book but the authors make an excellent attempt to do just this." P. Marriott for the Short Book Reviews of the ISI
"The intended readership of this book is anyone who is willing to explore a large dataset of their own as well as statisticians, computer scientists, and data analysts. … This is a valuable book for all the researchers who need practical guidance to explore their large datasets by the help of a variety of visualization methods. … We recommend this book for everyone interested in discovering structures hidden in the large datasets by a variety of state-of-the-art visualization techniques." (Tulay Koru-Sengul, Technometrics, Vol. 49 (3), August, 2007)
"The chief attractions of the book are its focus and clarity while dealing with a diverse range of topics andits simplicity of presentation....Thus, we can safely say that we recommend the book to anyone interested in the field of datat visualization. " (Rajesh Natarajan, Lev: Book Reviews, Interfaces 37(5), 2007)
"Data visualization is useful for data cleaning, exploring data, identifying trends and clusters, spotting local patterns, evaluating modelling output, and presenting results. It is also essential for exploratory data analysis and data mining. Given its subject matter, the book is well addressed to data analysts, statisticians, computer scientists, and anyone who has to explore a large dataset." (Christina Diakaki, Zentralblatt MATH, Vol. 1118 (20), 2007)
"I found the book informative, easy to read, and on target addressing an important and evolving need - the visualization of large datasets. The book contains many important points supported by examples, datasets, softare, and websites, which are accessible both intellectually and electronically." (Thomas Bradstreet, The American Statistician, Vol. 62 (2), 2008)
"The book has a Web site with files and code-settings for figures, links to software, and the most important datasets used. The style is very clear and makes pleasant reading. This book is full of inspiring ideas for all practicing statisticians, even for those who do not usually deal with large datasets." (Ricardo Maronna, Statistical Papers, Vol. 50, 2009)
Textul de pe ultima copertă
Graphics are great for exploring data, but how can they be used for looking at the large datasets that are commonplace to-day? This book shows how to look at ways of visualizing large datasets, whether large in numbers of cases or large in numbers of variables or large in both. Data visualization is useful for data cleaning, exploring data, identifying trends and clusters, spotting local patterns, evaluating modeling output, and presenting results. It is essential for exploratory data analysis and data mining. Data analysts, statisticians, computer scientists-indeed anyone who has to explore a large dataset of their own-should benefit from reading this book.
New approaches to graphics are needed to visualize the information in large datasets and most of the innovations described in this book are developments of standard graphics. There are considerable advantages in extending displays which are well-known and well-tried, both in understanding how best to make use of them in your work and in presenting results to others. It should also make the book readily accessible for readers who already have a little experience of drawing statistical graphics. All ideas are illustrated with displays from analyses of real datasets and the authors emphasize the importance of interpreting displays effectively. Graphics should be drawn to convey information and the book includes many insightful examples.
Antony Unwin holds the Chair of Computer Oriented Statistics and Data Analysis at the University of Augsburg. He has been involved in developing visualization software for twenty years. Martin Theus is a Senior Researcher at the University of Augsburg, has worked in industry and research in both Germany and the USA, and is the author of the visualization software Mondrian. Heike Hofmann is Assistant Professor of Statistics at Iowa State University. She wrote the software MANET and has also cooperated in the development of the GGobi software.
Caracteristici
Brings together a number of views on statistical graphics for large data sets Provides a useful account of work in the area by experts
