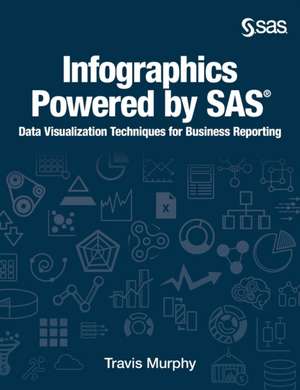
Infographics Powered by SAS: Data Visualization Techniques for Business Reporting (Hardcover edition)
Autor Travis Murphyen Limba Engleză Hardback – 12 aug 2019
Infographics Powered by SAS: Data Visualization Techniques for Business Reporting shows you how to create graphics to communicate information and insight from big data in the boardroom and on social media.
Learn how to create business infographics for all occasions with SAS and learn how to build a workflow that lets you get the most from your SAS system without having to code anything, unless you want to! This book combines the perfect blend of creative freedom and data governance that comes from leveraging the power of SAS and the familiarity of Microsoft Office.
Topics covered in this book include:
- SAS Office Analytics
- SAS/GRAPH software (SAS code examples)
- Data visualization with SAS
- Creating reports with SAS
- Using reports and graphs from SAS to create business presentations
- Using SAS within Microsoft Office
| Toate formatele și edițiile | Preț | Express |
|---|---|---|
| Paperback (1) | 222.65 lei 6-8 săpt. | |
| SAS Institute Inc. – 24 apr 2018 | 222.65 lei 6-8 săpt. | |
| Hardback (1) | 288.14 lei 6-8 săpt. | |
| SAS Institute Inc. – 12 aug 2019 | 288.14 lei 6-8 săpt. |
Preț: 288.14 lei
Preț vechi: 360.18 lei
-20% Nou
Puncte Express: 432
Preț estimativ în valută:
55.15€ • 57.36$ • 46.22£
55.15€ • 57.36$ • 46.22£
Carte tipărită la comandă
Livrare economică 13-27 martie
Preluare comenzi: 021 569.72.76
Specificații
ISBN-13: 9781642955132
ISBN-10: 1642955132
Pagini: 200
Dimensiuni: 196 x 241 x 15 mm
Greutate: 0.58 kg
Editura: SAS Institute Inc.
ISBN-10: 1642955132
Pagini: 200
Dimensiuni: 196 x 241 x 15 mm
Greutate: 0.58 kg
Editura: SAS Institute Inc.


