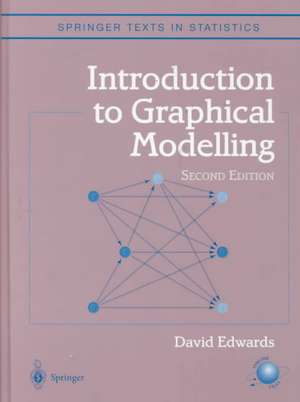
Introduction to Graphical Modelling: Springer Texts in Statistics
Autor David Edwardsen Limba Engleză Hardback – 15 iun 2000
| Toate formatele și edițiile | Preț | Express |
|---|---|---|
| Paperback (1) | 396.62 lei 6-8 săpt. | |
| Springer – 27 sep 2012 | 396.62 lei 6-8 săpt. | |
| Hardback (1) | 740.44 lei 6-8 săpt. | |
| Springer – 15 iun 2000 | 740.44 lei 6-8 săpt. |
Din seria Springer Texts in Statistics
- 15%
 Preț: 559.21 lei
 - 18%
 Preț: 903.62 lei
 -
 Preț: 359.53 lei
 - 18%
 Preț: 695.28 lei
 -
 Preț: 477.28 lei
 - 20%
 Preț: 700.50 lei
 - 20%
 Preț: 717.69 lei
 -
 Preț: 400.59 lei
 - 20%
 Preț: 567.29 lei
 - 20%
 Preț: 633.81 lei
 - 19%
 Preț: 546.32 lei
 - 20%
 Preț: 697.47 lei
 - 15%
 Preț: 676.86 lei
 - 19%
 Preț: 571.78 lei
 - 17%
 Preț: 525.26 lei
 - 20%
 Preț: 643.53 lei
 - 17%
 Preț: 428.39 lei
 - 13%
 Preț: 487.07 lei
 - 20%
 Preț: 764.91 lei
 -
 Preț: 269.47 lei
 - 15%
 Preț: 650.86 lei
 -
 Preț: 403.75 lei
 -
 Preț: 403.37 lei
 - 15%
 Preț: 578.67 lei
 - 19%
 Preț: 626.92 lei
 - 18%
 Preț: 948.29 lei
 - 18%
 Preț: 746.59 lei
 -
 Preț: 500.46 lei
 -
 Preț: 394.71 lei
 - 18%
 Preț: 946.69 lei
 - 15%
 Preț: 702.54 lei
 -
 Preț: 407.01 lei
 - 18%
 Preț: 895.89 lei
 - 15%
 Preț: 600.80 lei
 - 23%
 Preț: 684.77 lei
 - 19%
 Preț: 543.05 lei
 - 15%
 Preț: 595.86 lei
 -
 Preț: 423.18 lei
 - 15%
 Preț: 656.10 lei
 - 15%
 Preț: 682.90 lei
 - 18%
 Preț: 814.43 lei
 -
 Preț: 402.76 lei
 -
 Preț: 408.54 lei
 - 18%
 Preț: 759.52 lei
 - 15%
 Preț: 600.80 lei
Preț: 740.44 lei
Preț vechi: 902.97 lei
-18% Nou
Puncte Express: 1111
Preț estimativ în valută:
141.68€ • 148.32$ • 117.23£
141.68€ • 148.32$ • 117.23£
Carte tipărită la comandă
Livrare economică 05-19 aprilie
Preluare comenzi: 021 569.72.76
Specificații
ISBN-13: 9780387950549
ISBN-10: 0387950540
Pagini: 335
Ilustrații: XV, 335 p.
Dimensiuni: 178 x 254 x 27 mm
Greutate: 0.81 kg
Ediția:2nd ed. 2000
Editura: Springer
Colecția Springer
Seria Springer Texts in Statistics
Locul publicării:New York, NY, United States
ISBN-10: 0387950540
Pagini: 335
Ilustrații: XV, 335 p.
Dimensiuni: 178 x 254 x 27 mm
Greutate: 0.81 kg
Ediția:2nd ed. 2000
Editura: Springer
Colecția Springer
Seria Springer Texts in Statistics
Locul publicării:New York, NY, United States
Public țintă
ResearchCuprins
1 Preliminaries.- 1.1 Independence and Conditional Independence.- 1.2 Undirected Graphs.- 1.3 Data, Models, and Graphs.- 1.4 Simpson’s Paradox.- 1.5 Overview of the Book.- 2 Discrete Models.- 2.1 Three-Way Tables.- 2.2 Multi-Way Tables.- 3 Continuous Models.- 3.1 Graphical Gaussian Models.- 3.2 Regression Models.- 4 Mixed Models.- 4.1 Hierarchical Interaction Models.- 4.2 Breaking Models into Smaller Ones.- 4.3 Mean Linearity.- 4.4 Decomposable Models.- 4.5 CG-Regression Models.- 4.6 Incomplete Data.- 4.7 Discriminant Analysis.- 5 Hypothesis Testing.- 5.1 An Overview.- 5.2 X2-Tests.- 5.3 F-Tests.- 5.4 Exact Conditional Tests.- 5.5 Deviance-Based Tests.- 5.6 Permutation F-Test.- 5.7 Pearson x2-Test.- 5.8 Fisher’s Exact Test.- 5.9 Rank Tests.- 5.10 Wilcoxon Test.- 5.11 Kruskal-Wallis Test.- 5.12 Jonckheere-Terpstra Test.- 5.13 Tests for Variance Homogeneity.- 5.14 Tests for Equality of Means Given Homogeneity.- 5.15 Hotelling’s T2.- 6 Model Selection and Criticism.- 6.1 Stepwise Selection.- 6.2 The EH-Procedure.- 6.3 Selection Using Information Criteria.- 6.4 Comparison of the Methods.- 6.5 Box-Cox Transformations.- 6.6 Residual Analysis.- 6.7 Dichotomization.- 7 Directed Graphs and Their Models.- 7.1 Directed Acyclic Graphs.- 7.2 Chain Graphs.- 7.3 Local Independence Graphs.- 7.4 Covariance Graphs.- 7.5 Chain Graphs with Alternative Markov Properties.- 7.6 Reciprocal Graphs.- 8 Causal Inference.- 8.1 Philosophical Aspects.- 8.2 Rubin’s Causal Model.- 8.3 Pearl’s Causal Graphs.- 8.4 Discussion.- A The MINI Command Language.- A.1 Introduction.- A.2 Declaring Variables.- A.3 Undirected Models.- A.3.1 Deleting Edges.- A.3.2 Adding Edges.- A.3.3 Other Model-Changing Commands.- A.3.4 Model Properties.- A.4 Block-Recursive Models.- A.4.1 Defining the Block Structure.-A.4.2 Block Mode.- A.4.3 Defining Block-Recursive Models.- A.4.4 Working with Component Models.- A.5 Reading and Manipulating Data.- A.5.1 Reading Casewise Data.- A.5.2 Reading Counts, Means, and Covariances.- A.5.3 Transforming Data.- A.5.4 Restricting Observations.- A.5.5 Generating Raw Data.- A.5.6 Deleting Variables.- A.6 Estimation.- A.6.1 Undirected Models (Complete Data).- A.6.2 Undirected Models (Missing Data).- A.6.3 CG-Regression Models.- A.7 Hypothesis Testing.- A.7.1 x2-Tests.- A.7.2 Test of Homogeneity.- A.7.3 F-Tests.- A.7.4 Edge Deletion Tests.- A.7.5 Edge Deletion F-Tests.- A.7.6 Exact Tests.- A.7.7 Symmetry Tests.- A.7.8 Randomisation Tests.- A.8 Model Selection.- A.8.1 Stepwise Selection.- A.8.2 The EH-Procedure.- A.8.3 Selection Using Information Criteria.- A.9 The Box-Cox Transformation.- A.10 Residuals.- A.11 Discriminant Analysis.- A.12 Utilities.- A.12.1 File Input.- A.12.2 The Workspace.- A.12.3 Printing Information.- A.12.4 Displaying Parameter Estimates.- A.12.5 Displaying Summary Statistics.- A.12.6 Setting the Maximum Model.- A.12.7 Fixing Variables.- A.12.8 Macros.- B Implementation Specifics of MB’!.- B.1 Calling MIM.- B.2 The Main Menu.- B.3 Entering Commands and Navigating the Work Area.- B.4 The Built-In Editor.- B.5 Interactive Data Entry.- B.6 Independence Graphs.- B.7 Simple Data Graphics.- B.7.1 Scatter Plots.- B.7.2 Histograms.- B.7.3 Box Plots.- B.8 Graphics Export Formats.- B.9 Direct Database Access.- B.10 Program Intercommunication.- C On Multivariate Symmetry.- D On the Estimation Algorithms.- D.1 The MIPS Algorithm.- D.1.1 Notation.- D.1.2 The Likelihood Equations.- D.1.3 The General Algorithm.- D.1.4 The A-Collapsible Variant.- D.1.5 The Mean Linear Variant.- D.1.6 The Q-Equivalent Variant.- D.1.7 The Step-HalvingVariant.- D.2 The EM-Algorithm.- D.3 The ME-Algorithm.- References.
Recenzii
From the reviews:
JOURNAL OF THE AMERICAN STATISTICAL ASSOCIATION
"This is a valuable book that should increase in value over time. It seems clear that in the future, statisticians will need to deal with larger, more complicated collections of data…Any statistician who is planning to tackle the changing nature of data collection in the 21st Century should know about graphical models. This book provides a great place to begin learning about them."
SIAM REVIEW
"…this is an important book for all concerned with the statistical analysis of multivariate data such as arise particularly, but not only, in observational studies in the medical and social sciences. In a broader context it gives a thoughtful introduction to an active topic of current research."
TECHNOMETRICS
"This book’s strength is its accessibility. Numerous illustrations and example datasets are well integrated with the text…The examples are well chosen; I was particularly pleased that the author clearly treated datasets as interesting in their own right, not simply as a foil for demonstrating techniques…Edwards presents a clear, engaging introduction to graphical modeling that is very suitable as a first text and should stimulate readers to explore and use this methodology for their own data."


