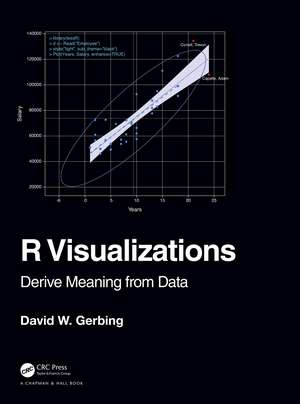
R Visualizations: Derive Meaning from Data
Autor David Gerbingen Limba Engleză Hardback – 12 mai 2020
Key Features
- Presents thorough coverage of the leading R visualization system, ggplot2.
- Gives specific guidance on using base R graphics to attain visualizations of the same quality as those provided by ggplot2.
- Shows how to create a wide range of data visualizations: distributions of categorical and continuous variables, many types of scatterplots including with a third variable, time series, and maps.
- Inclusion of the various approaches to R graphics organized by topic instead of by system.
- Presents the recent work on interactive visualization in R.
| Toate formatele și edițiile | Preț | Express |
|---|---|---|
| Paperback (1) | 395.81 lei 6-8 săpt. | |
| CRC Press – 13 dec 2021 | 395.81 lei 6-8 săpt. | |
| Hardback (1) | 599.01 lei 6-8 săpt. | |
| CRC Press – 12 mai 2020 | 599.01 lei 6-8 săpt. |
Preț: 599.01 lei
Preț vechi: 704.73 lei
-15% Nou
Puncte Express: 899
Preț estimativ în valută:
114.62€ • 120.22$ • 95.42£
114.62€ • 120.22$ • 95.42£
Carte tipărită la comandă
Livrare economică 01-15 aprilie
Preluare comenzi: 021 569.72.76
Specificații
ISBN-13: 9781138599635
ISBN-10: 1138599638
Pagini: 250
Ilustrații: 100
Dimensiuni: 210 x 280 x 16 mm
Greutate: 0.83 kg
Ediția:1
Editura: CRC Press
Colecția Chapman and Hall/CRC
ISBN-10: 1138599638
Pagini: 250
Ilustrații: 100
Dimensiuni: 210 x 280 x 16 mm
Greutate: 0.83 kg
Ediția:1
Editura: CRC Press
Colecția Chapman and Hall/CRC
Cuprins
1. R, Data and Visualizations. 2. R Visualization Quick Start. 3. Customization. 4. Visualize the Distribution of a Categorical Variable. 5. Visualize the Distribution of a Continuous Variable. 6. Visualize the Distributions of Values over Time. 7. Visualize Spatial Data with Maps. 8. Visualize Three Dimensions. 9 Visualize Dimensionality Reduction. 10. Interactive Visualizations.
Notă biografică
David W. Gerbing has a Quantitative Methods B.A. from Western Washington State College, and M.A. from Michigan State University, and a Ph.D. from Michigan State University. Dr. Gerbing teaches statistics, quantitative methods, and business research techniques. His research interests are in the areas of quantitative analysis, multivariate statistics, and behavioral measurement and assessment. Currently his primary interest is in the increasing the accessibility of the R programming language for data science so that non-programmers can access the free, open source data analysis system without a steep learning curve.
Recenzii
'Finally, this is an easy- to-read book to begin the data visualization by using R for those who want to start or to develop their background in R for data visualization. It is a good companion to facilitate the use of R for data visualization with less coding than the better known ggplot2 package.'
- Sébastien Bailly, International Society for Clinical Biostatistics, 71, 2021
- Sébastien Bailly, International Society for Clinical Biostatistics, 71, 2021
Descriere
This book is focused on one of the two major topics of doing data analysis: data visualization, aka, computer graphics. In one place the major R systems for visualization are discussed, organized by topic and not by system. Anyone doing data analysis will be shown how to use R to generate basic visualizations with any of R visualization systems.
