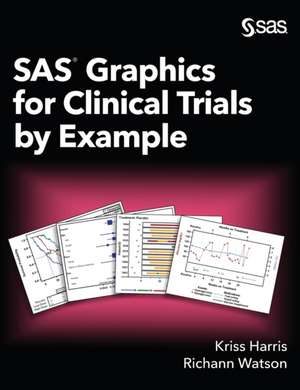
SAS Graphics for Clinical Trials by Example
Autor Kriss Harris, Richann Watsonen Limba Engleză Hardback – 25 noi 2020
SAS Graphics for Clinical Trials by Example demonstrates step-by-step how to create both simple and complex graphs using Graph Template Language (GTL) and statistical graphics procedures, including the SGPLOT and SGPANEL procedures. You will learn how to generate commonly used plots such as Kaplan-Meier plots and multi-cell survival plots as well as special purpose graphs such as Venn diagrams and interactive graphs. Because your graph is only as good as the aesthetic appearance of the output, you will learn how to create a custom style, change attributes, and set output options. Whether you are just learning how to produce graphs or have been working with graphs for a while, this book is a must-have resource to solve even the most challenging clinical graph problems.
| Toate formatele și edițiile | Preț | Express |
|---|---|---|
| Paperback (1) | 275.37 lei 6-8 săpt. | |
| SAS Institute Inc. – 25 noi 2020 | 275.37 lei 6-8 săpt. | |
| Hardback (1) | 358.28 lei 6-8 săpt. | |
| SAS Institute Inc. – 25 noi 2020 | 358.28 lei 6-8 săpt. |
Preț: 358.28 lei
Preț vechi: 447.85 lei
-20% Nou
Puncte Express: 537
Preț estimativ în valută:
68.56€ • 74.45$ • 57.59£
68.56€ • 74.45$ • 57.59£
Carte tipărită la comandă
Livrare economică 22 aprilie-06 mai
Preluare comenzi: 021 569.72.76
Specificații
ISBN-13: 9781952365997
ISBN-10: 1952365996
Pagini: 268
Dimensiuni: 196 x 241 x 19 mm
Greutate: 0.68 kg
Editura: SAS Institute Inc.
ISBN-10: 1952365996
Pagini: 268
Dimensiuni: 196 x 241 x 19 mm
Greutate: 0.68 kg
Editura: SAS Institute Inc.


