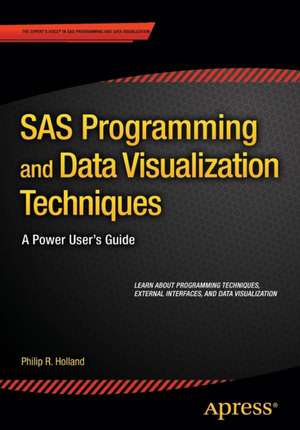
SAS Programming and Data Visualization Techniques: A Power User's Guide
Autor Philip R. Hollanden Limba Engleză Paperback – 13 aug 2015
Author Philip R. Holland advises a broad range of clients throughout Europe and the United States as an independent consultant and founder of Holland Numerics Ltd, a SAS technical consultancy. In this book he explains techniques—through code samples and example—that will enable you to increase your knowledge of all aspects of SAS programming, improve your coding productivity, and interface SAS with other programs.
He also provides an expert’s overview of Graph Templates, which was recently moved into Base SAS. You will learn to create attractive, standardized, reusable, and platform-independent graphs—both statistical and non-statistical—to help you and your business users explore, visualize, and capitalize on your company’s data. In addition, you will find many examples and cases pertaining to healthcare, finance, retail, and other industries.
Among other things, SAS Programming and Data Visualization Techniques will show you how to:
- Write efficient and reus
What You'll Learn
- How to write more efficient SAS code—either code that runs quicker, code that is easier to maintain, or both
- How to do more with the SAS components you already license
- How to take advantage of the newest features in SAS
- How to interface external applications with SAS software
- How to create graphs using SAS ODS Graphics
Who This Book Is For
SAS programmers wanting to improve their existing programming skills, and programming managers wanting to make better use of the SAS software they already license.
SAS programmers wanting to improve their existing programming skills, and programming managers wanting to make better use of the SAS software they already license.
Preț: 260.33 lei
Preț vechi: 325.41 lei
-20% Nou
Puncte Express: 390
Preț estimativ în valută:
49.81€ • 52.15$ • 41.22£
49.81€ • 52.15$ • 41.22£
Carte disponibilă
Livrare economică 15-29 martie
Preluare comenzi: 021 569.72.76
Specificații
ISBN-13: 9781484205693
ISBN-10: 1484205693
Pagini: 250
Ilustrații: XXI, 245 p. 150 illus.
Dimensiuni: 178 x 254 x 17 mm
Greutate: 0.48 kg
Ediția:1st ed.
Editura: Apress
Colecția Apress
Locul publicării:Berkeley, CA, United States
ISBN-10: 1484205693
Pagini: 250
Ilustrații: XXI, 245 p. 150 illus.
Dimensiuni: 178 x 254 x 17 mm
Greutate: 0.48 kg
Ediția:1st ed.
Editura: Apress
Colecția Apress
Locul publicării:Berkeley, CA, United States
Public țintă
Popular/generalCuprins
Part One: Programming Efficiency Techniques.- Chapter 1: The Basics of Efficient SAS Coding.- Chapter 2: How to Use Look-up Tables Effectively.- Chapter 3: Case: SAS Skills in Epidemiology.- Part Two: External Interfaces.- Chapter 4: SAS to R to SAS.- Chapter 5: Knit Perl and SAS for DIY Web Applications.- Chapter 6: Case: Running Clinical Trials Programs in Enterprise Guide.- Chapter 7: Running SAS Programs in SAS Studio.- Chapter 8: Everyday Uses for SAS Output Delivery System (ODS).- Part Three: Data Visualization.- Chapter 9: Introduction to Graph Templates.- Chapter 10: Introduction to ODS Graphics Procedures.- Chapter 11: Generating Graph Templates.- Chapter 12: Converting SAS/GRAPH Plots to ODS Graphics.- Chapter 13: Customizing Graph Templates.- Chapter 14: ODS GRAPHICS Statement.
Notă biografică
Philip R. Holland has over 25 years of experience of working with SAS software. Having started in 1981 as an MVS Systems Programmer for the University of London Computer Centre (ULCC), he moved on to Prudential Assurance where, as an MVS Systems Programmer and Performance Analyst, he was the company's SAS technical support representative. His third and final permanent SAS position as a Capacity Planner to Centrefile ended in 1992, when he formed his own consultancy company, Holland Numerics Ltd. Since then, he has provided SAS technical consultancy on all the major platforms that support SAS software in the financial, retail and pharmaceutical sectors in the UK, Belgium, Holland, and Germany.Holland, the author of thirty articles and conference papers relating to SAS, is an enthusiastic software developer, not only using SAS, but also Perl, Java, JavaScript and Visual Basic. The author of three books, his latest project has been to develop SAS-related eBook apps.
Caracteristici
SAS Programming and Data Visualization Techniques: A Power User’s Guide brings together a wealth of ideas about strategic and tactical solutions to everyday situations experienced when transferring, extracting, processing, analyzing, and reporting data. Most of the solutions can be achieved using the SAS components you already license, eliminating the need to throw money at the problems.


