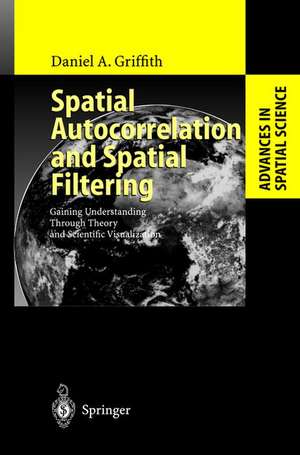
Spatial Autocorrelation and Spatial Filtering: Gaining Understanding Through Theory and Scientific Visualization: Advances in Spatial Science
Autor Daniel A. Griffithen Limba Engleză Hardback – 10 iul 2003
| Toate formatele și edițiile | Preț | Express |
|---|---|---|
| Paperback (1) | 943.07 lei 6-8 săpt. | |
| Springer Berlin, Heidelberg – 5 dec 2010 | 943.07 lei 6-8 săpt. | |
| Hardback (1) | 949.23 lei 6-8 săpt. | |
| Springer Berlin, Heidelberg – 10 iul 2003 | 949.23 lei 6-8 săpt. |
Din seria Advances in Spatial Science
-
 Preț: 368.91 lei
 - 18%
 Preț: 963.47 lei
 - 18%
 Preț: 948.16 lei
 - 18%
 Preț: 947.67 lei
 - 18%
 Preț: 940.72 lei
 - 18%
 Preț: 954.45 lei
 - 15%
 Preț: 646.62 lei
 - 18%
 Preț: 959.50 lei
 - 18%
 Preț: 956.33 lei
 - 15%
 Preț: 646.75 lei
 - 15%
 Preț: 643.99 lei
 - 18%
 Preț: 955.40 lei
 - 15%
 Preț: 643.00 lei
 - 15%
 Preț: 644.49 lei
 - 18%
 Preț: 953.35 lei
 - 18%
 Preț: 956.03 lei
 - 15%
 Preț: 647.27 lei
 - 15%
 Preț: 638.24 lei
 - 18%
 Preț: 961.23 lei
 - 18%
 Preț: 954.93 lei
 - 15%
 Preț: 643.48 lei
 - 18%
 Preț: 955.70 lei
 - 15%
 Preț: 650.86 lei
 - 15%
 Preț: 650.04 lei
 - 15%
 Preț: 648.42 lei
 - 18%
 Preț: 949.42 lei
 - 18%
 Preț: 960.30 lei
 - 18%
 Preț: 948.29 lei
 - 18%
 Preț: 958.07 lei
 - 18%
 Preț: 950.66 lei
 - 18%
 Preț: 956.03 lei
 - 15%
 Preț: 643.65 lei
 - 18%
 Preț: 956.99 lei
 - 18%
 Preț: 956.81 lei
 - 18%
 Preț: 958.73 lei
 - 18%
 Preț: 959.98 lei
 - 18%
 Preț: 952.40 lei
 - 15%
 Preț: 643.00 lei
Preț: 949.23 lei
Preț vechi: 1157.60 lei
-18% Nou
Puncte Express: 1424
Preț estimativ în valută:
181.63€ • 189.64$ • 150.33£
181.63€ • 189.64$ • 150.33£
Carte tipărită la comandă
Livrare economică 04-18 aprilie
Preluare comenzi: 021 569.72.76
Specificații
ISBN-13: 9783540009320
ISBN-10: 3540009329
Pagini: 268
Ilustrații: XIV, 250 p.
Dimensiuni: 155 x 235 x 20 mm
Greutate: 0.55 kg
Ediția:2003
Editura: Springer Berlin, Heidelberg
Colecția Springer
Seria Advances in Spatial Science
Locul publicării:Berlin, Heidelberg, Germany
ISBN-10: 3540009329
Pagini: 268
Ilustrații: XIV, 250 p.
Dimensiuni: 155 x 235 x 20 mm
Greutate: 0.55 kg
Ediția:2003
Editura: Springer Berlin, Heidelberg
Colecția Springer
Seria Advances in Spatial Science
Locul publicării:Berlin, Heidelberg, Germany
Public țintă
ResearchCuprins
1 Introduction.- 1.1 Scientific Visualization.- 1.2 What Is Spatial Autocorrelation?.- 1.3 Selected Visualization Tools: An Overview.- 1.4 The Sample Georeferenced Datasets.- 2 Salient Properties of Geographic Connectivity Underlying Spatial Autocorrelation.- 2.1 Eigenfunctions Associated with Geographic Connectivity Matrices.- 2.2 Generalized Eigenvalue Frequency Distributions.- 2.3 The Auto-Gaussian Jacobian Term Normalizing Factor.- 2.4 Eigenfunctions Associated with the GR.- 2.5 Remarks and Discussion.- 3 Sampling Distributions Associated with Spatial Autocorrelation.- 3.1 Samples as Random Permutations of Values across Locations on a Man: Randomization.- 3.2 Simple Random Samples at Each Location on a Map: Unconstrained Selection.- 3.3 Samples as Ordered Random Drawings from a Parent Frequency Distribution: Extending the Permutation Perspective.- 3.4 Samples as Outcomes of a Multivariate Drawing: Extending the Simple Random Samnling Persnective.- 3.5 Effective Sample Size.- 3.6. Remarks and Discussion.- 4 Spatial Filtering.- 4.1 Eigenvector-based Spatial Filtering.- 4.2 Coefficients for Single and Linear Combinations of Distinct Map Patterns.- 4.3 Eigenvector Selection Criteria.- 4.4 Regression Analysis: Standard Errors Based upon Simulation Experiments and Resampling.- 4.5 The MC Local Statistic and Illuminating Diagnostics.- 4.6 Remarks and Discussion.- 5 Spatial Filtering Applications: Selected Interval/Ratio Datasets.- 5.1 Geographic Distributions of Settlement Size in Peru.- 5.2 The Geographic Distribution of Lyme Disease in Georgia.- 5.3 The Geographic Distribution or Biomass in the Hign Peak District.- 5.4 The Geographic Distribution of Agricultural and Topographic Variables in Puerto Rico.- 5.5 Remarks and Discussion.- 6 Spatial Filtering Applications: Selected Counts Datasets.- 6.1 Geographic Distributions of Settlement Counts in Pennsylvania.- 6.2 The Geographic Distribution of Farms in Loiza, Puerto Rico.- 6.3 The Geographic Distribution of Volcanoes in Uganda.- 6.4 The Geographic Distribution of Cholera Deaths in London.- 6.5 The Geographic Distribution of Drumlins in Ireland.- 6.6 Remarks and Discussion.- 7 Spatial Filtering Applications: Selected Percentage Datasets.- 7.1 The Geographic Distribution of the Presence/Absence of Plant Disease in an Agricultural Field.- 7.2 The Geographic Distribution of Plant Disease in an Agricultural Field.- 7.3 The Geographic Distribution of Blood Group A in Eire.- 7.4 The Geographic Distribution of Urbanization across the Island of Puerto Rico.- 7.5 Remarks and Discussion.- 8 Concluding Comments.- 8.1 Spatial Filtering versus Spatial Autoregression.- 8.2 Some Numerical Issues in Spatial Filtering.- 8.3 Stepwise Selection of Eigenvectors for an Auto-Poisson Model.- 8.4 Binomial and Poisson Overdispersion.- 8.5 Future Research: What Next?.- List of Symbols.- List of Tables.- List of Figures.- References.- Author Index.- Place Index.
Recenzii
From the reviews:
"Daniel Griffith here makes an effort to expand the methodological toolbox of spatial analysis by presenting, analyzing, and meticulously demonstrating with numerous examples, the applications of spatial filtering … . In sum, many readers will find the book an appealing source of geographic and statistical material, richly supplemented by the use of scientific visualization … . Conceivably, spatial researchers will appreciate its invigorating introduction to mathematical-geographical properties of spatial datasets, and the statisticians will enjoy its many witty and challenging examples." (Oleg Smirnov, Journal of Regional Science, Vol. 44 (3), 2004)
"Daniel Griffith here makes an effort to expand the methodological toolbox of spatial analysis by presenting, analyzing, and meticulously demonstrating with numerous examples, the applications of spatial filtering … . In sum, many readers will find the book an appealing source of geographic and statistical material, richly supplemented by the use of scientific visualization … . Conceivably, spatial researchers will appreciate its invigorating introduction to mathematical-geographical properties of spatial datasets, and the statisticians will enjoy its many witty and challenging examples." (Oleg Smirnov, Journal of Regional Science, Vol. 44 (3), 2004)
Textul de pe ultima copertă
Advances in Spatial Science
This series of books is dedicated to reporting on recent advances in spatial science. It contains scientific studies focusing on spatial phenomena, utilising theoretical frameworks, analytical methods, and empirical procedures specifically designed for spatial analysis. The series brings together innovative spatial research utilising concepts, perspectives, and methods with a relevance to both basic science and policy making. The aim is to present advances in spatial science to an informed readership in universities, research organisations, and policy-making institutions throughout the world.
The type of material considered for publication in the series includes:
- Monographs of theoretical and applied research in spatial science;
- State-of-the-art volumes in areas of basic research;
- Reports of innovative theories and methods in spatial science;
- Tightly edited reports form specially organised research seminars.
Manuscripts must be prepared in accordance with the guidelines for authors and editors that may be obtained from Springer-Verlag. Manuscripts considered for the series will be reviewed by independent experts to ensure their originality, scientific level, and international policy relevance.
Caracteristici
This book is about spatial statistics and spatial analysis.- The large number of georeferenced data analysis from various parts of the world is of particular interest to the reader. These datasets contain interval/ratio, binary, percentage and counts variables.- Enables the reader to effectively visualize and analyze spatial autocorrelation latent n georeferenced data.
