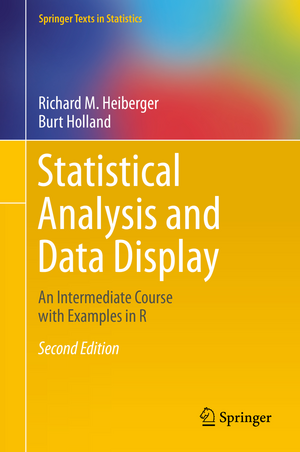
Statistical Analysis and Data Display: An Intermediate Course with Examples in R: Springer Texts in Statistics
Autor Richard M. Heiberger, Burt Hollanden Limba Engleză Hardback – 24 dec 2015
This book can serve as a standalone text for statistics majors at the master’s level and for other quantitatively oriented disciplines at the doctoral level, and as a reference book for researchers. Classical concepts and techniques are illustrated with a variety of case studies using both newer graphical tools and traditional tabular displays.
New graphical material includes:
- an expanded chapter on graphics
- a section on graphing Likert Scale Data to build on the importance of rating scales in fields from population studies to psychometrics
- a discussion on design of graphics that will work for readers with color-deficient vision
- an expanded discussion on the design of multi-panel graphics
- expanded and new sections in the discrete bivariate statistics capter on the use of mosaic plots for contingency tables including the n×2×2 tables for which the Mantel–Haenszel–Cochran test is appropriate
- an interactive (using the shiny package) presentation of the graphics for the normal and t-tables that is introduced early and used in many chapters
| Toate formatele și edițiile | Preț | Express |
|---|---|---|
| Paperback (2) | 625.42 lei 38-44 zile | |
| Springer – 20 mar 2019 | 625.42 lei 38-44 zile | |
| Springer – 19 noi 2010 | 1241.70 lei 6-8 săpt. | |
| Hardback (1) | 885.10 lei 38-44 zile | |
| Springer – 24 dec 2015 | 885.10 lei 38-44 zile |
Din seria Springer Texts in Statistics
- 15%
 Preț: 559.21 lei
 - 18%
 Preț: 903.62 lei
 -
 Preț: 359.53 lei
 - 18%
 Preț: 695.28 lei
 -
 Preț: 477.28 lei
 - 20%
 Preț: 700.50 lei
 - 20%
 Preț: 692.84 lei
 -
 Preț: 400.59 lei
 - 20%
 Preț: 567.29 lei
 - 20%
 Preț: 633.81 lei
 - 19%
 Preț: 539.86 lei
 - 20%
 Preț: 697.47 lei
 - 15%
 Preț: 676.86 lei
 - 19%
 Preț: 571.78 lei
 - 17%
 Preț: 525.26 lei
 - 20%
 Preț: 643.53 lei
 - 17%
 Preț: 428.39 lei
 - 13%
 Preț: 487.07 lei
 - 20%
 Preț: 764.91 lei
 -
 Preț: 269.47 lei
 - 15%
 Preț: 650.86 lei
 -
 Preț: 403.75 lei
 -
 Preț: 403.37 lei
 - 15%
 Preț: 584.26 lei
 - 19%
 Preț: 626.92 lei
 - 18%
 Preț: 948.29 lei
 - 18%
 Preț: 746.59 lei
 -
 Preț: 500.46 lei
 -
 Preț: 394.71 lei
 - 18%
 Preț: 952.09 lei
 - 15%
 Preț: 702.54 lei
 -
 Preț: 407.01 lei
 - 18%
 Preț: 895.89 lei
 - 15%
 Preț: 600.80 lei
 - 23%
 Preț: 684.77 lei
 - 19%
 Preț: 543.05 lei
 - 15%
 Preț: 595.86 lei
 -
 Preț: 423.18 lei
 - 15%
 Preț: 656.10 lei
 - 15%
 Preț: 682.90 lei
 - 18%
 Preț: 814.43 lei
 -
 Preț: 402.76 lei
 -
 Preț: 408.54 lei
 - 18%
 Preț: 759.52 lei
 - 15%
 Preț: 600.80 lei
Preț: 885.10 lei
Preț vechi: 1149.48 lei
-23% Nou
Puncte Express: 1328
Preț estimativ în valută:
169.37€ • 177.64$ • 140.99£
169.37€ • 177.64$ • 140.99£
Carte tipărită la comandă
Livrare economică 28 martie-03 aprilie
Preluare comenzi: 021 569.72.76
Specificații
ISBN-13: 9781493921218
ISBN-10: 1493921215
Pagini: 898
Ilustrații: XXXI, 898 p. 341 illus., 326 illus. in color.
Dimensiuni: 155 x 235 x 41 mm
Greutate: 1.43 kg
Ediția:2nd ed. 2015
Editura: Springer
Colecția Springer
Seria Springer Texts in Statistics
Locul publicării:New York, NY, United States
ISBN-10: 1493921215
Pagini: 898
Ilustrații: XXXI, 898 p. 341 illus., 326 illus. in color.
Dimensiuni: 155 x 235 x 41 mm
Greutate: 1.43 kg
Ediția:2nd ed. 2015
Editura: Springer
Colecția Springer
Seria Springer Texts in Statistics
Locul publicării:New York, NY, United States
Recenzii
“It is a thorough and self-contained book. Keeping with the spirit with earlier edition, the second edition is well organized and structured and builds on statistical knowledge and its appreciation in a logical and concise manner. The book provides a host of useful topics and techniques for students in the niche of statistical analysis and data display. The book can adopted as textbook for an intermediate level statistics course.” (S. E. Ahmed, Technometrics, Vol. 58 (3), August, 2016)
Notă biografică
Richard M. Heiberger is Professor Emeritus in the Department of Statistics of Temple University, an elected Fellow of the American Statistical Association, and a former Chair of the Section on Statistical Computing of the American Statistical Association. He was Graduate Chair for the Department of Statistics and Acting Associate Vice Provost for the University. He participated in the design of the linear model and analysis of variance functions while on research leave at Bell Labs. He has taught short courses at the Joint Statistics Meetings, the American Statistical Association Conference on Statistical Practice, the R Users Conference, and the Deming Conference on Applied Statistics. He has consulted with several pharmaceutical companies.
Burt Holland was Professor in the Department of Statistics of Temple University, an elected Fellow of the American Statistical Association, Chair of the Department of Statistics of Temple University, and Chair of Collegial Assembly of the Fox School. He has taught short courses at the Joint Statistics Meetings and the Deming Conference on Applied Statistics. He has made many contributions to linear modeling and simultaneous statistical inference. He frequently served as consultant to medical investigators. He developed a very popular General Education course on Statistics and the News.
Burt Holland was Professor in the Department of Statistics of Temple University, an elected Fellow of the American Statistical Association, Chair of the Department of Statistics of Temple University, and Chair of Collegial Assembly of the Fox School. He has taught short courses at the Joint Statistics Meetings and the Deming Conference on Applied Statistics. He has made many contributions to linear modeling and simultaneous statistical inference. He frequently served as consultant to medical investigators. He developed a very popular General Education course on Statistics and the News.
Textul de pe ultima copertă
This contemporary presentation of statistical methods features
extensive use of graphical displays for exploring data and for
displaying the analysis. The authors demonstrate how to analyze
data—showing code, graphics, and accompanying tabular listings—for
all the methods they cover. They emphasize how to construct and
interpret graphs. They discuss principles of graphical design. They
identify situations where visual impressions from graphs may need
confirmation from traditional tabular results. All chapters have
exercises.
The authors provide and discuss R functions for all the new graphical
display formats. All graphs and tabular output in the book were
constructed using these functions. Complete R scripts for all examples
and figures are provided for readers to use as models for their own
analyses.
This book can serve as a standalone text for statistics majors at the
master’s level and for other quantitatively oriented disciplines at
the doctoral level, and as a reference book for researchers. In-depth
discussions of regression analysis, analysis of variance, and design
of experiments are followed by introductions to analysis of discrete
bivariate data, nonparametrics, logistic regression, and ARIMA time
series modeling. The authors illustrate classical concepts and
techniques with a variety of case studies using both newer graphical
tools and traditional tabular displays.
The Second Edition features graphs that are completely redrawn using
the more powerful graphics infrastructure provided by R's lattice
package. There are new sections in several of the chapters, revised
sections in all chapters and several completely new appendices.
New graphical material includes:
• an expanded chapter on graphics;
• a section on graphing Likert Scale Data to build on the importance of
rating scales in fields from population studies to psychometrics;
• a discussion on design of graphics that will work for readers with
color-deficient vision;
• an expanded discussion on the design of multi-panel graphics;
• expanded and new sections in the discrete bivariate statistics chapter
on the use of mosaic plots for contingency tables including the n×2×2
tables for which the Mantel–Haenszel–Cochran test is appropriate;
• an interactive (using the shiny package) presentation of the graphics
for the normal and t-tables that is introduced early and used in many
chapters.
The new appendices include discussions of R, the HH package
designed for R (the material in the HH package was distributed as a
set of standalone functions with the First Edition of this book), the
R Commander package, the RExcel system, the shiny package, and a
minimal discussion on writing R packages. There is a new appendix on
computational precision illustrating and explaining the FAQ
(Frequently Asked Questions) about the differences between the
familiar real number system and the less-familiar floating point
system used in computers. The probability distributions appendix has
been expanded to include more distributions (all the distributions in
base R) and to include graphs of each. The editing appendix from the
First Edition has been split into four expanded appendices—on working
style, writing style, use of a powerful editor, and use of LaTeX for
document preparation.
Caracteristici
le, and Text Editing Tools) Reproducibility: all graphs and tables in the book can be reproduced in R by the user with scripts included in the HH package available from CRAN and all datasets used in the book are also available for use with other software systems New edition continues the exposition of data analysis methods with examples and graphics of distributions, regression, analysis of variance, design of experiments, contingency table analysis, nonparametrics, logistic regression, and time series analysis Features color graphics throughout, with R code to produce all figures and tables in the book New sections: on Likert Scale Data to pick up on the importance of rating scales in fields from population studies to psychometrics; on Medical, Pharmaceutical, and Social Science Examples; on mosaic graphics for discrete data; and on perception of graphics including discussions of color vision, microplots, and structured sets of graphs and panels New and expanded appendices on software (HH, Shiny, Rcmdr, RExcel), mathematics (Computational Precision and Floating-Point Arithmetic, Mathematics Preliminaries, Probability Distributions), and Statistical Analysis and Writing (Working Style, Writing Sty Includes supplementary material: sn.pub/extras
Cuprins
1 Introduction and Motivation.- 2 Data and Statistics.- 3 Statistics Concepts.- 4 Graphs.- 5 Introductory Inference.- 6 One-Way Analysis of Variance.- 7 Multiple Comparisons.- 8 Linear Regression by Least Squares.- 9 Multiple Regression—More Than One Predictor.- 10 Multiple Regression—Dummy Variables and Contrasts.- 11 Multiple Regression—Regression Diagnostics.- 12 Two-Way Analysis of Variance.- 13 Design of Experiments—Factorial Designs.- 14 Design of Experiments—Complex Designs.- 15 Bivariate Statistics—Discrete Data.- 16 Nonparametrics.- 17 Logistic Regression.- 18 Time Series Analysis.- A Software.- A.1 Statistical Software.- A.2 Text Editing Software.- A.2.1 Emacs.- A.2.2 Microsoft Word.- A.3 Word Processing Software.- A.3.2 Microsoft Word.- A.4 Graphics Display Software.- A.5 Operating Systems.- A.6 Mathematical Fonts.- A.7 Directory Structure.- A.7.1 HOME Directory.- A.7.2 HH Book Online Files.- B.1 Create Your Working Directory and Make the HH Library Available.- B.1.3 Windows and R.- B.1.6 Unix and R.- B.4 HH Library Functions.- B.5 Learning the S Language.- B.6 S Language Style.- C SAS.- C.1 Make the HH Library Available.- C.1.1 Windows.- C.1.2 Unix.- C.2 Using SAS with HH.- C.2.1 Reading HH Datasets.- C.2.2 Any Other Data Files.- C.2.3 ASCII Data Files with TAB Characters.- C.2.4 Windows and Unix EOL (End-of-Line) Conventions.- C.3 Macros.- C.4 Learning the SAS Language.- C.5 SAS Coding Conventions.- D Probability Distributions.- D.1.1 An Example Involving Calculations with the Binomial Distribution.- D.2 Noncentral Probability Distributions.- E Editors.- E.1 Working Style.- E.2 Typography.- E.3 Emacs and ESS.- E.3.1 ESS.- E.3.2 Mouse and Keyboard.- E.3.3 Learning Emacs.- E.3.4 Requirements.- E.4 Microsoft Word.- E.4.1 Learning Word.- E.4.2Requirements 6.- E.5 Microsoft Excel.- E.5.1 Database Management.- E.5.2 Organizing Calculations.- E.5.3 Excel as a Statistical Calculator.- E.6 Exhortations, Some of Which Are Writing Style.- E.6.1 Writing Style.- E.6.2 Programming Style and Common Errors.- E.6.3 Presentation of Results.- F Mathematics Preliminaries.- F.1 Algebra Review.- F.2 Elementary Differential Calculus.- F.3 An Application of Differential Calculus.- F.4 Topics in Matrix Algebra.- F.4.1 Elementary Operations.- F.4.2 Linear Independence.- F.4.3 Rank.- F.4.4 Quadratic Forms.- F.4.5 Orthogonal Transformations.- F.4.6 Orthogonal Basis.- F.4.8 Matrix Factorization—Cholesky.- F.4.9 Orthogonal Polynomials.- F.4.10 Projection Matrices.- F.4.11 Geometry ot Mlatrices.- F.4.12 Eigenvalues and Eigenvectors.- F.4.13 Singular Value Decomposition.- F.4.14 Generalized Inverse.- F.4.15 Solving Linear Equations.- F.5 Combinations and Permutations.- F.5.1 Factorial.- F.5.2 Permutations.- F.5.3 Combinations.- F.6 Exercises.- G Graphs Based on Cartesian Products.- G.1 Structured Sets of Graphs.- G.1.1 Cartesian Products.- G.1.2 Trellis Paradigm.- G.2 Scatterplot Matrices: splom and xysplom.- G.3 Cartesian Products of Sets of Functions.- G.4 Graphs Requiring Multiple Calls to xysplom.- G.5 Asymmetric Roles for the Row and Column Sets.- G.6 Rotated Plots.- G.7 Squared Residual Plots.- G.8 Alternate Presentations.- References.- List of Datasets.


