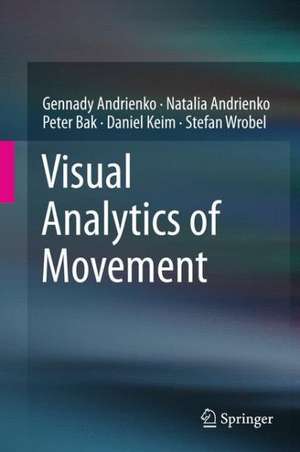
Visual Analytics of Movement
Autor Gennady Andrienko, Natalia Andrienko, Peter Bak, Daniel Keim, Stefan Wrobelen Limba Engleză Hardback – 7 oct 2013
This is exactly the topic of this book. As the authors show, modern visual analytics techniques are ready to tackle the enormous challenges brought about by movement data, and the technology and software needed to exploit them are available today.
The authors start by illustrating the different kinds of data available to describe movement, from individual trajectories of single objects to multiple trajectories of many objects, and then proceed to detail a conceptual framework, which provides the basis for a fundamental understanding of movement data. With this basis, they move on to more practical and technical aspects, focusing on how to transform movement data to make it more useful, and on the infrastructure necessary for performing visual analytics in practice. In so doing they demonstrate that visual analytics of movement data can yield exciting insights into the behavior of moving persons and objects, but can also lead to an understanding of the events that transpire when things move. Throughout the book, they use sample applications from various domains and illustrate the examples with graphical depictions of both the interactive displays and the analysis results.
In summary, readers will benefit from this detailed description of the state of the art in visual analytics in various ways. Researchers will appreciate the scientific precision involved, software technologists will find essential information on algorithms and systems, and practitioners will profit from readily accessible examples with detailed illustrations for practical purposes.
| Toate formatele și edițiile | Preț | Express |
|---|---|---|
| Paperback (1) | 650.92 lei 6-8 săpt. | |
| Springer Berlin, Heidelberg – 23 aug 2016 | 650.92 lei 6-8 săpt. | |
| Hardback (1) | 655.85 lei 6-8 săpt. | |
| Springer Berlin, Heidelberg – 7 oct 2013 | 655.85 lei 6-8 săpt. |
Preț: 655.85 lei
Preț vechi: 819.82 lei
-20% Nou
Puncte Express: 984
Preț estimativ în valută:
125.51€ • 130.55$ • 103.62£
125.51€ • 130.55$ • 103.62£
Carte tipărită la comandă
Livrare economică 14-28 aprilie
Preluare comenzi: 021 569.72.76
Specificații
ISBN-13: 9783642375828
ISBN-10: 3642375820
Pagini: 415
Ilustrații: XVIII, 387 p. 200 illus., 178 illus. in color.
Dimensiuni: 155 x 235 x 27 mm
Greutate: 0.7 kg
Ediția:2013
Editura: Springer Berlin, Heidelberg
Colecția Springer
Locul publicării:Berlin, Heidelberg, Germany
ISBN-10: 3642375820
Pagini: 415
Ilustrații: XVIII, 387 p. 200 illus., 178 illus. in color.
Dimensiuni: 155 x 235 x 27 mm
Greutate: 0.7 kg
Ediția:2013
Editura: Springer Berlin, Heidelberg
Colecția Springer
Locul publicării:Berlin, Heidelberg, Germany
Public țintă
ResearchCuprins
Introduction.- Conceptual framework.- Transformations of movement data.- Visual analytics infrastructure.- Visual analytics focusing on movers.- Visual analytics focusing on spatial events.- Visual analytics focusing on space.- Visual analytics focusing on time.- Discussion and outlook.
Notă biografică
Natalia and Gennady Andrienko have been lead scientists for visual analytics research at the Fraunhofer Institute for Intelligent Analysis and Information Systems (IAIS) in Germany since 2007. Their research interests include geovisualization, information visualization with a focus on spatial and temporal data, visual analytics, interactive knowledge discovery and data mining, and spatial decision support and optimization.
Peter Bak, PhD, has been a senior scientis at IBM Research Lab, Haifa since 2010. He works in the field of visual analytics mainly for the spatiotemporal domain. He is mainly interested in the development and design of new techniques for the analysis and interactive visualization of real time movement and historical collection of trajectory data. He is continuously contributing to academic, but also to industrial application domains.
Daniel Keim is a Professor of Data Mining and Visualization at the University of Konstanz, Germany. His main areas of research are databases, data mining, information visualization, and visual analytics. In 2011, he received the Visualization Technical Achievement Award from the IEEE VGTC in recognition of his seminal technical work in high-dimensional data analysis and visualization of large databases.
Stefan Wrobel holds a joint position as a Professor of Computer Science at the University of Bonn and Institute Director of the Fraunhofer IAIS. His main interests are in machine learning, data analysis, and pattern recognition. He is an Elected Founding Member of the International Machine Learning Society.
Textul de pe ultima copertă
Many important planning decisions in society and business depend on proper knowledge and a correct understanding of movement, be it in transportation, logistics, biology, or the life sciences. Today the widespread use of mobile phones and technologies like GPS and RFID provides an immense amount of data on location and movement. What is needed are new methods of visualization and algorithmic data analysis that are tightly integrated and complement each other to allow end-users and analysts to extract useful knowledge from these extremely large data volumes.
This is exactly the topic of this book. As the authors show, modern visual analytics techniques are ready to tackle the enormous challenges brought about by movement data, and the technology and software needed to exploit them are available today.
The authors start by illustrating the different kinds of data available to describe movement, from individual trajectories of single objects to multiple trajectories of many objects, and then proceed to detail a conceptual framework, which provides the basis for a fundamental understanding of movement data. With this basis, they move on to more practical and technical aspects, focusing on how to transform movement data to make it more useful, and on the infrastructure necessary for performing visual analytics in practice. In so doing they demonstrate that visual analytics of movement data can yield exciting insights into the behavior of moving persons and objects, but can also lead to an understanding of the events that transpire when things move. Throughout the book, they use sample applications from various domains and illustrate the examples with graphical depictions of both the interactive displays and the analysis results.
In summary, readers will benefit from this detailed description of the state of the art in visual analytics in various ways. Researchers will appreciate the scientific precision involved, software technologists will find essential information on algorithms and systems, and practitioners will profit from readily accessible examples with detailed illustrations for practical purposes.
Caracteristici
Presents a multidisciplinary approach, combining methods from e.g. visualization, data mining, cartography, and geographical information science Introduces a general conceptual framework for the analysis of movement data from various sources Illustrates all algorithms and methods with the help of sample applications from various domains Includes supplementary material: sn.pub/extras
