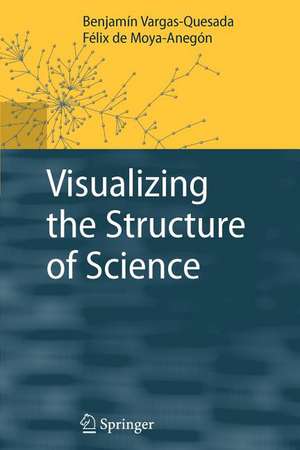
Visualizing the Structure of Science
Autor Benjamín Vargas-Quesada, Félix de Moya-Anegónen Limba Engleză Paperback – 15 oct 2010
Vargas-Quesada and Moya-Anegón propose a methodology for visualizing large scientific domains. They create science maps, so-called "scientograms", based on the interactions between authors and their papers through citations and co-citations, using approaches such as domain analysis, social networks, cluster analysis and pathfinder networks. The resulting scientograms offer manifold possibilities. Domain analysts can discover the most significant connections between categories of a given domain, and they can also see how these categories are grouped into major thematic areas and how they are interrelated through a logical internal, while information scientists or researchers new to an area may appreciate a durable image of the essential structure of a domain.
| Toate formatele și edițiile | Preț | Express |
|---|---|---|
| Paperback (1) | 988.16 lei 6-8 săpt. | |
| Springer Berlin, Heidelberg – 15 oct 2010 | 988.16 lei 6-8 săpt. | |
| Hardback (1) | 995.09 lei 6-8 săpt. | |
| Springer Berlin, Heidelberg – 14 mai 2007 | 995.09 lei 6-8 săpt. |
Preț: 988.16 lei
Preț vechi: 1235.19 lei
-20% Nou
Puncte Express: 1482
Preț estimativ în valută:
189.10€ • 196.23$ • 158.06£
189.10€ • 196.23$ • 158.06£
Carte tipărită la comandă
Livrare economică 17-31 martie
Preluare comenzi: 021 569.72.76
Specificații
ISBN-13: 9783642089138
ISBN-10: 3642089135
Pagini: 320
Ilustrații: VIII, 312 p. 83 illus.
Dimensiuni: 155 x 235 x 17 mm
Greutate: 0.45 kg
Ediția:Softcover reprint of hardcover 1st ed. 2007
Editura: Springer Berlin, Heidelberg
Colecția Springer
Locul publicării:Berlin, Heidelberg, Germany
ISBN-10: 3642089135
Pagini: 320
Ilustrații: VIII, 312 p. 83 illus.
Dimensiuni: 155 x 235 x 17 mm
Greutate: 0.45 kg
Ediția:Softcover reprint of hardcover 1st ed. 2007
Editura: Springer Berlin, Heidelberg
Colecția Springer
Locul publicării:Berlin, Heidelberg, Germany
Public țintă
ResearchCuprins
Visualization.- Visualization of Scientific Information and Domain Analysis.- Methodological Aspects Previous to Scientography.- Material Used.- Methodology.- Results.- Discussion.- Epilogue.
Recenzii
From the reviews:
"Numerous aspects of the book are unequivocally so new … . Just about anyone involved in Information Technology and Documentation Sciences will be fascinated by this new approach … . The well-stocked Bibliography will permit novices an easy entry into this new research field … . The book’s excellent overview of a difficult subject matter is highly recommended to experts. … the philosophy, methodology, technology, science and pedagogy presented are unique and important! To the authors: congratulations!" (Karl H. Wolf, International Journal of General Systems, 2008)
"Numerous aspects of the book are unequivocally so new … . Just about anyone involved in Information Technology and Documentation Sciences will be fascinated by this new approach … . The well-stocked Bibliography will permit novices an easy entry into this new research field … . The book’s excellent overview of a difficult subject matter is highly recommended to experts. … the philosophy, methodology, technology, science and pedagogy presented are unique and important! To the authors: congratulations!" (Karl H. Wolf, International Journal of General Systems, 2008)
Textul de pe ultima copertă
Constructing a great map of the sciences has been a persistent dream since the Middle Ages. In modern times this need has become even more urgent because of the requirement to combine and link research in adjacent areas, often resulting in new disciplines such as bioinformatics and nanotechnologies. Computer visualization helps humans to perceive and understand large and complex structures, such as molecular structures or data dependencies.
Vargas-Quesada and Moya-Anegón propose a methodology for visualizing large scientific domains. They create science maps, so-called "scientograms", based on the interactions between authors and their papers through citations and co-citations, using approaches such as domain analysis, social networks, cluster analysis and pathfinder networks. The resulting scientograms offer manifold possibilities. Domain analysts can discover the most significant connections between categories of a given domain, and they can also see how these categories are grouped into major thematic areas and how they are interrelated through a logical internal, while information scientists or researchers new to an area may appreciate a durable image of the essential structure of a domain.
Vargas-Quesada and Moya-Anegón propose a methodology for visualizing large scientific domains. They create science maps, so-called "scientograms", based on the interactions between authors and their papers through citations and co-citations, using approaches such as domain analysis, social networks, cluster analysis and pathfinder networks. The resulting scientograms offer manifold possibilities. Domain analysts can discover the most significant connections between categories of a given domain, and they can also see how these categories are grouped into major thematic areas and how they are interrelated through a logical internal, while information scientists or researchers new to an area may appreciate a durable image of the essential structure of a domain.
Caracteristici
Includes supplementary material: sn.pub/extras
