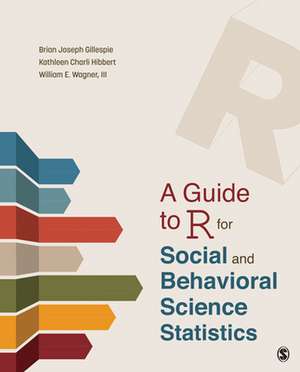
A Guide to R for Social and Behavioral Science Statistics
Autor Brian Joseph Gillespie, Kathleen Charli Hibbert, William E. Wagneren Limba Engleză Paperback – 20 mai 2020
Preț: 393.55 lei
Preț vechi: 504.56 lei
-22% Nou
Puncte Express: 590
Preț estimativ în valută:
75.31€ • 78.99$ • 62.69£
75.31€ • 78.99$ • 62.69£
Carte disponibilă
Livrare economică 11-25 martie
Livrare express 25 februarie-01 martie pentru 31.19 lei
Preluare comenzi: 021 569.72.76
Specificații
ISBN-13: 9781544344027
ISBN-10: 1544344023
Pagini: 304
Dimensiuni: 187 x 232 x 24 mm
Greutate: 0.5 kg
Ediția:1
Editura: SAGE Publications
Colecția Sage Publications, Inc
Locul publicării:Thousand Oaks, United States
ISBN-10: 1544344023
Pagini: 304
Dimensiuni: 187 x 232 x 24 mm
Greutate: 0.5 kg
Ediția:1
Editura: SAGE Publications
Colecția Sage Publications, Inc
Locul publicării:Thousand Oaks, United States
Recenzii
This text is most timely given the popular use of R in many introductory stats courses throughout our universities. The reader will find the presentation of visuals, tips, and syntax in using R to be most impressive relative to what other books provide! This is a "must have" text for faculty and students embarking on a stats course that utilizes the R program.
Finally, a statistics book that makes statistics clear to those who hate statistics.
"A Guide to R for Social and Behavioral Sciences" provides just the right balance between coverage of statistical concepts ad R guidelines. It eliminates the need to adopt a separate textbook for statistics and an R workbook.
This is a great resource for both undergraduate and graduate students for training in fields increasingly utilizing R in data analyses!
This is an excellent comprehensive book that fills in many of the gaps that researchers struggle to find in many sources. This is a great reference for Social and Behavioral scientists who want to get quickly to applying concepts using R, getting results, and understanding them.
This text is a welcome addition to the existing works that seek to explain how to use R and R Studio. The authors do a marvelous job in breaking the program down to its most basic elements for beginners and advanced users as they undertake numerous statistical procedures. Some of the finest qualities of the work are the visuals and screenshots that give readers the confidence they need to run statistics using R in the most proficient means possible!
Cuprins
Preface
Acknowledgments
About the Authors
Chapter 1 • R and RStudio®
Introduction
Statistical Software Overview
Downloading R and RStudio
RStudio
Finding R and RStudio Packages
Opening Data
Saving Data Files
Conclusion
Chapter 2 • Data, Variables, and Data Management
About the Data and Variables
Structure and Organization of Classic “Wide” Datasets
The General Social Survey
Variables and Measurement
Recoding Variables
Logic of Coding
Recoding Missing Values
Computing Variables
Removing Outliers
Conclusion
Chapter 3 • Data Frequencies and Distributions
Frequencies for Categorical Variables
Cumulative Frequencies and Percentages
Frequencies for Interval/Ratio Variables
Histograms
The Normal Distribution
Non-Normal Distribution Characteristics
Exporting Tables
Conclusion
Chapter 4 • Central Tendency and Variability
Measures of Central Tendency
Measures of Variability
The z-Score
Selecting Cases for Analysis
Conclusion
Chapter 5 • Creating and Interpreting Univariate and Bivariate Data Visualizations
Introduction
R’s Color Palette
Univariate Data Visualization
Bivariate Data Visualization
Exporting Figures
Conclusion
Chapter 6 • Conceptual Overview of Hypothesis Testing and Effect Size
Introduction
Null and Alternative Hypotheses
Statistical Significance
Test Statistic Distributions
Choosing a Test of Statistical Significance
Hypothesis Testing Overview
Effect Size
Conclusion
Chapter 7 • Relationships Between Categorical Variables
Single Proportion Hypothesis Test
Goodness of Fit
Bivariate Frequencies
The Chi-Square Test of Independence (?2)
Conclusion
Chapter 8 • Comparing One or Two Means
Introduction
One-Sample t-Test
The Independent Samples t-Test
Examples
Additional Independent Samples t-Test Examples
Effect Size for t-Test: Cohen’s d
Paired t-Test
Conclusion
Chapter 9 • Comparing Means Across Three or More Groups (ANOVA)
Analysis of Variance (ANOVA)
ANOVA in R
Two-Way Analysis of Variance
Conclusion
Chapter 10 • Correlation and Bivariate Regression
Review of Scatterplots
Correlations
Pearson’s Correlation Coefficient
Coefficient of Determination
Correlation Tests for Ordinal Variables
The Correlation Matrix
Bivariate Linear Regression
Logistic Regression
Conclusion
Chapter 11 • Multiple Regression
The Multiple Regression Equation
Interaction Effects and Interpretation
Logistic Regression
Interpretation and Presentation of Logistic Regression Results
Conclusion
Chapter 12 • Advanced Regression Topics
Advanced Regression Topics
Polynomials
Logarithms
Scaling Data
Multicollinearity
Multiple Imputation
Further Exploration
Conclusion
Index
Notă biografică
Brian Joseph Gillespie, Ph.D.is a researcher in the Faculty of Spatial Sciences at the University of Groningen in the Netherlands. He is the author of Household Mobility in America: Patterns, Processes, and Outcomes (Palgrave, 2017) and coauthor of The Practice of Survey Research: Theory and Applications (Sage, 2016) and Using and Interpreting Statistics in the Social, Behavioral, and Health Sciences (Sage, 2018). He has also published research in a variety of social science journals on topics related to family, migration, the life course, and interpersonal relationships.
Descriere
Geared toward social and behavioural statistics students, especially those with no background in computer science, this handy guide contains basic information on statistics in the R language.
