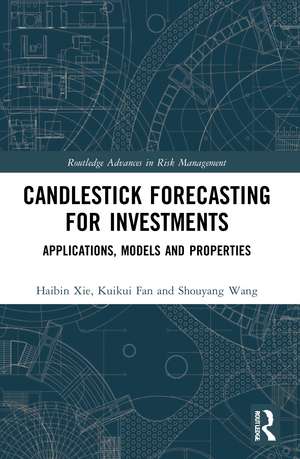
Candlestick Forecasting for Investments: Applications, Models and Properties: Routledge Advances in Risk Management
Autor Haibin Xie, Kuikui Fan, Shouyang Wangen Limba Engleză Paperback – 26 sep 2022
Through decomposition-based modeling techniques and empirical datasets, the book investigates the power of, and establishes the statistical foundation of, candlestick forecasting.
| Toate formatele și edițiile | Preț | Express |
|---|---|---|
| Paperback (1) | 308.10 lei 3-5 săpt. | +10.65 lei 6-12 zile |
| Taylor & Francis – 26 sep 2022 | 308.10 lei 3-5 săpt. | +10.65 lei 6-12 zile |
| Hardback (1) | 997.27 lei 6-8 săpt. | |
| Taylor & Francis – 12 mar 2021 | 997.27 lei 6-8 săpt. |
Din seria Routledge Advances in Risk Management
-
 Preț: 341.55 lei
 -
 Preț: 310.22 lei
 -
 Preț: 309.59 lei
 - 14%
 Preț: 299.52 lei
 -
 Preț: 412.57 lei
 - 17%
 Preț: 271.82 lei
 -
 Preț: 409.87 lei
 - 17%
 Preț: 268.78 lei
 -
 Preț: 381.72 lei
 -
 Preț: 384.46 lei
 - 17%
 Preț: 254.66 lei
 -
 Preț: 389.38 lei
 -
 Preț: 185.02 lei
 - 18%
 Preț: 1052.35 lei
 -
 Preț: 389.66 lei
 -
 Preț: 360.70 lei
 -
 Preț: 389.66 lei
 -
 Preț: 385.71 lei
 -
 Preț: 386.39 lei
Preț: 308.10 lei
Nou
Puncte Express: 462
Preț estimativ în valută:
58.95€ • 61.43$ • 48.81£
58.95€ • 61.43$ • 48.81£
Carte disponibilă
Livrare economică 13-27 martie
Livrare express 26 februarie-04 martie pentru 20.64 lei
Preluare comenzi: 021 569.72.76
Specificații
ISBN-13: 9780367703394
ISBN-10: 0367703394
Pagini: 132
Ilustrații: 29 Tables, black and white; 18 Line drawings, black and white; 8 Halftones, black and white; 26 Illustrations, black and white
Dimensiuni: 156 x 234 x 13 mm
Greutate: 0.14 kg
Ediția:1
Editura: Taylor & Francis
Colecția Routledge
Seria Routledge Advances in Risk Management
Locul publicării:Oxford, United Kingdom
Public țintă
PostgraduateCuprins
PART I INTRODUCTION AND OUTLINE 1. Introduction 1.1 Technical analysis before the 1970s 1.2 Technical analysis during 1990s–2000s 1.3 Recent advances in technical analysis 1.4 Summary 2. Outline of this book PART II CANDLESTICK 3. Basic concepts 4. Statistical properties 4.1 Propositions 4.2 Simulations 4.3 Empirical evidence 4.4 Summary PART III STATISTICAL MODELS 5. DVAR model 5.1 The model 5.2 Statistical foundation 5.3 Simulations 5.4 Empirical results 5.5 Summary 6. Shadows in DVAR 6.1 Simulations 6.2 Theoretical explanation 6.3 Empirical evidence 6.4 Summary PART IV APPLICATIONS 7. Market volatility timing 7.1 Introduction 7.2 GARCH@CARR model 7.3 Economic value of volatility timing 7.4 Empirical results 7.5 Summary 8. Technical range forecasting 8.1 Introduction 8.2 Econometric methods 8.3 An empirical study 8.4 Summary 9. Technical range spillover 9.1 Introduction 9.2 Econometric method 9.3 An empirical study: DAX and CAC40 9.4 Summary 10. Stock return forecasting: U.S. S&P500 10.1 Introduction 10.2 Econometric methods 10.3 Statistical evidence 10.4 Economic evidence 10.5 More details 10.6 Summary 11. Oil price forecasting: WTI Crude Oil 11.1 Introduction 11.2 Econometric method 11.3 Empirical results 11.4 Summary PART V CONCLUSIONS AND FUTURE STUDIES 12. Main conclusions 13. Future studies
Notă biografică
Haibin Xie is Associate Professor at the School of Banking and Finance, University of International Business and Economics.
Kuikui Fan is affiliated with the School of Statistics, Capital University of Economics and Business.
Shouyang Wang is Professor at the Academy of Mathematics and Systems Science, Chinese Academy of Sciences.
Kuikui Fan is affiliated with the School of Statistics, Capital University of Economics and Business.
Shouyang Wang is Professor at the Academy of Mathematics and Systems Science, Chinese Academy of Sciences.
Descriere
Candlestick charts are often used in speculative markets to describe and forecast asset price movements. This book is the first of its kind to investigate candlestick charts and their statistical properties.
