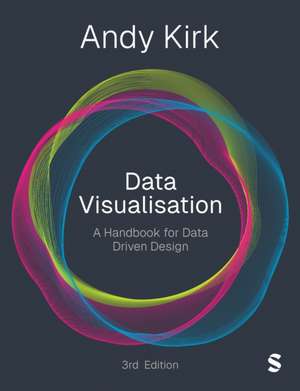
Data Visualisation
Autor Andy Kirken Limba Engleză Paperback – 28 noi 2024
| Toate formatele și edițiile | Preț | Express |
|---|---|---|
| Paperback (2) | 351.51 lei 3-5 săpt. | +30.31 lei 4-10 zile |
| SAGE Publications – 20 aug 2019 | 351.51 lei 3-5 săpt. | +30.31 lei 4-10 zile |
| SAGE Publications Ltd – 28 noi 2024 | 383.31 lei 17-23 zile | +40.35 lei 4-10 zile |
Preț: 383.31 lei
Nou
73.34€ • 76.78$ • 60.69£
Carte disponibilă
Livrare economică 14-20 martie
Livrare express 01-07 martie pentru 50.34 lei
Specificații
ISBN-10: 1529626544
Pagini: 304
Dimensiuni: 193 x 245 x 25 mm
Greutate: 0.71 kg
Ediția:Third Edition
Editura: SAGE Publications Ltd
Recenzii
While most works in this space focus on data journalism, scientific visualisations or other specialist audiences, this book targets decision makers and helps with everything from initial concepts and data preparation to editorial layouts. A refreshing angle and a compelling read.
What do we actually mean when we talk about Data Visualisation? How do we 'do it’? How can we ensure our research using Data Visualisation is effective and ethical? The answers are all here in this inspirational and invaluable guide.
Everything I loved in the first edition of this valuable book has been incorporated into the second, including Kirk’s typology of data visualisation and masses of visual examples, but with more precise written arguments. This volume continues to fill the gap between overwhelming data and the visualisations that can facilitate understanding.
In this second edition, Andy adds relevant content to what was already a fantastic framework for learning the fundamentals of data visualization, all with acute and critical eyes. As an educator, I find it an invaluable resource to students and myself alike.
Cuprins
INTRODUCTION
PART A FOUNDATIONS
Chapter 1 Defining Data Visualisation
Chapter 2 The Visualisation Design Process
PART B THE HIDDEN THINKING
Chapter 3 Formulating Your Brief
Chapter 4 Working With Data
Chapter 5 Establishing Your Editorial Thinking
PART C DESIGN THINKING
Chapter 6 Data Representation
Chapter 7 Interactivity
Chapter 8 Annotation
Chapter 9 Colour
Chapter 10 Composition
EPILOGUE
Notă biografică
Andy Kirk is a UK-based data visualisation specialist. He has been a freelance professional since founding Visualising Data Ltd in 2011 and has been the editor of award-winning website www.visualisingdata.com since 2010. Andy provides design consultancy and delivers training workshops to organisations across all industries all around the world. He is a visiting lecturer on Masters degree programmes at the Maryland Institute College of Art (MICA, USA) and Imperial College, London.
