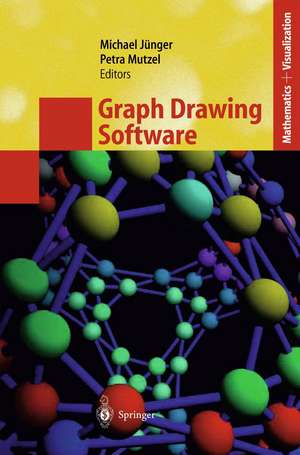
Graph Drawing Software: Mathematics and Visualization
Editat de Michael Jünger, Petra Mutzelen Limba Engleză Paperback – 28 oct 2012
In mathematical terms, such relational structures are modeled as graphs or more general objects such as hypergraphs, clustered graphs, or compound graphs. A variety of layout algorithms that are based on graph theoretical foundations have been developed in the last two decades and implemented in software systems.
After an introduction to the subject area and a concise treatment of the technical foundations for the subsequent chapters, this book features 14 chapters on state-of-the-art graph drawing software systems, ranging from general "tool boxes'' to customized software for various applications. These chapters are written by leading experts, they follow a uniform scheme and can be read independently from each other.
| Toate formatele și edițiile | Preț | Express |
|---|---|---|
| Paperback (1) | 991.94 lei 6-8 săpt. | |
| Springer Berlin, Heidelberg – 28 oct 2012 | 991.94 lei 6-8 săpt. | |
| Hardback (1) | 1002.18 lei 6-8 săpt. | |
| Springer Berlin, Heidelberg – 27 aug 2003 | 1002.18 lei 6-8 săpt. |
Din seria Mathematics and Visualization
- 20%
 Preț: 935.20 lei
 - 18%
 Preț: 960.93 lei
 - 18%
 Preț: 1110.41 lei
 - 20%
 Preț: 994.26 lei
 - 18%
 Preț: 1220.57 lei
 - 18%
 Preț: 958.38 lei
 - 15%
 Preț: 654.62 lei
 - 20%
 Preț: 997.38 lei
 - 15%
 Preț: 645.47 lei
 - 5%
 Preț: 1101.58 lei
 - 20%
 Preț: 992.44 lei
 - 20%
 Preț: 1284.47 lei
 - 20%
 Preț: 656.69 lei
 - 20%
 Preț: 476.68 lei
 - 20%
 Preț: 1273.08 lei
 - 15%
 Preț: 649.54 lei
 - 20%
 Preț: 335.36 lei
 - 20%
 Preț: 646.95 lei
 - 20%
 Preț: 651.75 lei
 - 20%
 Preț: 657.99 lei
 - 18%
 Preț: 1223.74 lei
 - 20%
 Preț: 333.72 lei
 - 20%
 Preț: 709.98 lei
 - 18%
 Preț: 1236.38 lei
 - 20%
 Preț: 992.26 lei
 - 20%
 Preț: 648.44 lei
 - 20%
 Preț: 1158.59 lei
 - 20%
 Preț: 330.66 lei
 - 18%
 Preț: 963.91 lei
 - 15%
 Preț: 653.98 lei
 - 18%
 Preț: 958.07 lei
Preț: 991.94 lei
Preț vechi: 1239.91 lei
-20% Nou
Puncte Express: 1488
Preț estimativ în valută:
189.81€ • 202.97$ • 158.26£
189.81€ • 202.97$ • 158.26£
Carte tipărită la comandă
Livrare economică 18 aprilie-02 mai
Preluare comenzi: 021 569.72.76
Specificații
ISBN-13: 9783642622144
ISBN-10: 3642622143
Pagini: 396
Ilustrații: XII, 378 p.
Dimensiuni: 155 x 235 x 21 mm
Greutate: 0.55 kg
Ediția:Softcover reprint of the original 1st ed. 2004
Editura: Springer Berlin, Heidelberg
Colecția Springer
Seria Mathematics and Visualization
Locul publicării:Berlin, Heidelberg, Germany
ISBN-10: 3642622143
Pagini: 396
Ilustrații: XII, 378 p.
Dimensiuni: 155 x 235 x 21 mm
Greutate: 0.55 kg
Ediția:Softcover reprint of the original 1st ed. 2004
Editura: Springer Berlin, Heidelberg
Colecția Springer
Seria Mathematics and Visualization
Locul publicării:Berlin, Heidelberg, Germany
Public țintă
ResearchCuprins
References.- Technical Foundations.- 1 Introduction.- 2 Graphs and Their Representation.- 3 Graph Planarity and Embeddings.- 4 Graph Drawing Methods.- References.- WilmaScope — A 3D Graph Visualization System.- 1 Introduction.- 2 Applications.- 3 Algorithms.- 4 Implementation.- 5 Examples.- 6 Software.- References.- Pajek — Analysis and Visualization of Large Networks.- 1 Introduction.- 2 Applications.- 3 Algorithms.- 4 Implementation.- 5 Examples.- 6 Software.- References.- Tulip — A Huge Graph Visualization Framework.- 1 Introduction.- 2 Applications.- 3 Algorithms.- 4 Implementation.- 5 Examples.- 6 Software.- References.- Graphviz and Dynagraph — Static and Dynamic Graph Drawing Tools.- 1 Introduction.- 2 Applications.- 3 Algorithms.- 4 Implementation.- 5 Examples.- 6 Software.- References.- AGD — A Library of Algorithms for Graph Drawing.- 1 Introduction.- 2 Applications.- 3 Algorithms.- 4 Implementation.- 5 Examples.- 6 Software.- References.- yFiles — Visualization and Automatic Layout of Graphs.- 1 Introduction.- 2 Applications.- 3 Algorithms.- 4 Implementation.- 5 Examples.- 6 Software.- References.- GDS — A Graph Drawing Server on the Internet.- 1 Introduction.- 2 Applications.- 3 Algorithms.- 4 Implementation.- 5 Examples.- 6 Software.- References.- BioPath — Exploration and Visualization of Biochemical Pathways.- 1 Introduction.- 2 Applications.- 3 Algorithms.- 4 Implementation.- 5 Examples.- 6 Software.- References.- DBdraw — Automatic Layout of Relational Database Schemas.- 1 Introduction.- 2 Applications.- 3 Algorithms.- 4 Implementation.- 5 Examples.- 6 Software.- References.- GoVisual — A Diagramming Software for UML Class Diagrams.- 1 Introduction.- 2 Applications.- 3 Algorithms.- 4 Implementation.- 5 Examples.- 6 Software.-References.- CrocoCosmos — 3D Visualization of Large Object-oriented Programs.- 1 Introduction.- 2 Applications.- 3 Algorithms.- 4 Implementation.- 5 Examples.- 6 Software.- References.- ViSta — Visualizing Statecharts.- 1 Introduction.- 2 Applications.- 3 Algorithms.- 4 Implementation.- 5 Examples.- 6 Software.- References.- visone — Analysis and Visualization of Social Networks.- 1 Introduction.- 2 Applications.- 3 Algorithms.- 4 Implementation.- 5 Examples.- 6 Software.- References.- Polyphemus and Hermes — Exploration and Visualization of Computer Networks.- 1 Introduction.- 2 Applications.- 3 Algorithms.- 4 Implementation.- 5 Examples.- 6 Software.- References.
Recenzii
From the reviews:
"This very interesting volume presents fourteen different software packages devoted to find (aesthetically nice) drawings of large respectively huge graphs. … All these packages are described by their developers who are all leading experts in the field of graph drawing. … The volume … can insistently be recommended to researchers in operations research (especially graph theory) and all practitioners who deal with large data sets and need to find relations between the data." (Stephan Dempe, OR News, Issue 25, 2005)
"The spacious layout of the text, interleaved with so many colourful figures, makes the book a pleasure to read. … While it is clearly of interest to members of the graph drawing community, this book is in fact geared to potential users of the software tools in other areas … . it definitely deserves a place on a library’s bookshelves as well as on the bookshelves of those who wish to enhance their teaching and research presentations with compelling depictions of graphs." (M Anjos, Journal of the Operational Research Society, Vol. 56 (5), 2005)
Caracteristici
Cross-section of the new field of graph drawing software The introductory part (chapters 1, 2) is excellent for beginners in the subject Covers many industrial applications Includes supplementary material: sn.pub/extras
