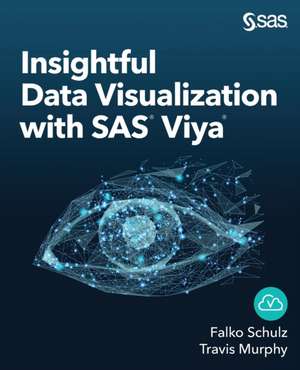
Insightful Data Visualization with SAS Viya
Autor Falko Schulz, Travis Murphyen Limba Engleză Paperback – 26 oct 2020
Data visualization is the gateway to artificial intelligence (AI) and big data. Insightful Data Visualization with SAS Viya shows how the latest SAS Viya tools can be used to create data visualizations in an easier, smarter, and more engaging way than ever before. SAS Visual Analytics combined with human creativity can produce endless possibilities. In this book, you will learn tips and techniques for getting the most from your SAS Visual Analytics investment. From beginners to advanced SAS users, this book has something for everyone. Use AI wizards to create data visualization automatically, learn to use advanced analytics in your dashboards to surface smarter insights, and learn to extend SAS Visual Analytics with advanced integrations and options.
Topics covered in this book include:
- SAS Visual Analytics
- Data visualization with SAS
- Reports and dashboards
- SAS code examples
- Self-service analytics
- SAS data access
- Extending SAS beyond drag and drop
| Toate formatele și edițiile | Preț | Express |
|---|---|---|
| Paperback (1) | 199.83 lei 6-8 săpt. | |
| SAS Institute Inc. – 26 oct 2020 | 199.83 lei 6-8 săpt. | |
| Hardback (1) | 267.26 lei 6-8 săpt. | |
| SAS Institute Inc. – 26 oct 2020 | 267.26 lei 6-8 săpt. |
Preț: 199.83 lei
Preț vechi: 249.78 lei
-20% Nou
Puncte Express: 300
Preț estimativ în valută:
38.24€ • 40.00$ • 31.76£
38.24€ • 40.00$ • 31.76£
Carte tipărită la comandă
Livrare economică 03-17 aprilie
Preluare comenzi: 021 569.72.76
Specificații
ISBN-13: 9781951684341
ISBN-10: 1951684346
Pagini: 202
Dimensiuni: 191 x 235 x 11 mm
Greutate: 0.35 kg
Editura: SAS Institute Inc.
ISBN-10: 1951684346
Pagini: 202
Dimensiuni: 191 x 235 x 11 mm
Greutate: 0.35 kg
Editura: SAS Institute Inc.
Notă biografică
Falko Schulz is widely regarded as one of the best infographic data visualization creators using drag-and-drop tools like SAS Visual Analytics. He is also a distinguished developer in SAS R&D, making SAS Visual Analytics what it is today. His creative approach has produced many stunning visualization examples. Falko has been involved in many projects over the years helping customers to visualize business insights and tell data stories. He is an active SAS community member and is enabling SAS users by sharing technical papers, data visualization examples, and blogs posts to explain and show the capabilities of SAS. Falko Schulz is a Distinguished Software Developer in the SAS Business Intelligence Research and Development division. He works actively on products such as SAS Visual Analytics, further enhancing user experience and analytical capabilities. Falko has a strong background in delivering business analytical applications in a wide range of industries. Prior to joining the R&D division, Falko worked in customer-facing roles and was responsible for critical technical implementations and BI architectural designs. During his 20 years at SAS, Falko has worked in various countries including Germany, Australia, and the US.


