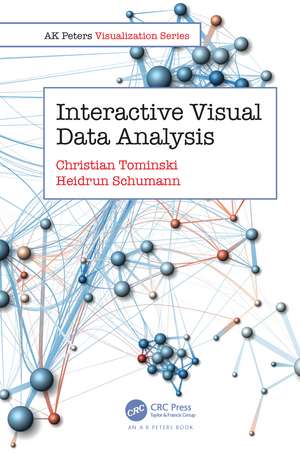
Interactive Visual Data Analysis: AK Peters Visualization Series
Autor Christian Tominski, Heidrun Schumannen Limba Engleză Hardback – 15 apr 2020
The book provides a systematic and comprehensive overview of visual, interactive, and analytical methods. It introduces criteria for designing interactive visual data analysis solutions, discusses factors influencing the design, and examines the involved processes. The reader is made familiar with the basics of visual encoding and gets to know numerous visualization techniques for multivariate data, temporal data, geo-spatial data, and graph data. A dedicated chapter introduces general concepts for interacting with visualizations and illustrates how modern interaction technology can facilitate the visual data analysis in many ways. Addressing today’s large and complex data, the book covers relevant automatic analytical computations to support the visual data analysis. The book also sheds light on advanced concepts for visualization in multi-display environments, user guidance during the data analysis, and progressive visual data analysis.
The authors present a top-down perspective on interactive visual data analysis with a focus on concise and clean terminology. Many real-world examples and rich illustrations make the book accessible to a broad interdisciplinary audience from students, to experts in the field, to practitioners in data-intensive application domains.
Features:
- Dedicated to the synthesis of visual, interactive, and analysis methods
- Systematic top-down view on visualization, interaction, and automatic analysis
- Broad coverage of fundamental and advanced visualization techniques
- Comprehensive chapter on interacting with visual representations
- Extensive integration of automatic computational methods
- Accessible portrayal of cutting-edge visual analytics technology
- Foreword by Jack van Wijk
| Toate formatele și edițiile | Preț | Express |
|---|---|---|
| Paperback (1) | 378.71 lei 3-5 săpt. | +27.37 lei 4-10 zile |
| CRC Press – 30 apr 2020 | 378.71 lei 3-5 săpt. | +27.37 lei 4-10 zile |
| Hardback (1) | 1119.27 lei 6-8 săpt. | |
| CRC Press – 15 apr 2020 | 1119.27 lei 6-8 săpt. |
Preț: 1119.27 lei
Preț vechi: 1364.96 lei
-18% Nou
Puncte Express: 1679
Preț estimativ în valută:
214.20€ • 222.80$ • 176.83£
214.20€ • 222.80$ • 176.83£
Carte tipărită la comandă
Livrare economică 15-29 aprilie
Preluare comenzi: 021 569.72.76
Specificații
ISBN-13: 9781498753982
ISBN-10: 1498753981
Pagini: 364
Ilustrații: 217
Dimensiuni: 156 x 234 x 25 mm
Greutate: 0.69 kg
Ediția:1
Editura: CRC Press
Colecția A K Peters/CRC Press
Seria AK Peters Visualization Series
ISBN-10: 1498753981
Pagini: 364
Ilustrații: 217
Dimensiuni: 156 x 234 x 25 mm
Greutate: 0.69 kg
Ediția:1
Editura: CRC Press
Colecția A K Peters/CRC Press
Seria AK Peters Visualization Series
Public țintă
AcademicCuprins
Foreword by Jarke J. van Wijk. Preface. Author Bios. 1. Introduction. 2. Criteria, Factors, and Models. 3. Visualization Methods and Techniques. 4. Interacting with Visualizations. 5. Automatic Analysis Support. 6. Advanced Concepts. 7. Summary. Bibliography. Index. Figure Credits
Notă biografică
Christian Tominski is a researcher and lecturer at the Institute for Visual & Analytic Computing at the University of Rostock, Germany. He received doctoral (Dr.-Ing.) and post-doctoral (Dr.-Ing. habil.) degrees in 2006 and 2015, respectively. His main research interests are in visualization of and interaction with data. He is particularly interested in effective and efficient techniques for interactively exploring and editing complex data. Christian has published numerous papers on new visualization and interaction techniques for multivariate data, temporal data, geo-spatial data, and graphs. He co-authored two books on the visualization of time-oriented data in 2011 and on interaction for visualization in 2015. Christian has developed several visualization systems and tools, including the LandVis system for spatio-temporal health data, the VisAxes tool for time-oriented data, and the CGV system for coordinated graph visualization.
Heidrun Schumann is a professor at the University of Rostock, Germany, where she is heading the Chair of Computer Graphics at the Institute for Visual & Analytic Computing. She received doctoral degree (Dr.-Ing.) in 1981 and post-doctoral degree (Dr.-Ing. habil.) in 1989. Her research and teaching activities cover a variety of topics related to computer graphics, including information visualization, visual analytics, and rendering. She is interested in visualizing complex data in space and time, combining visualization and terrain rendering, and facilitating visual data analysis with progressive methods. A key focus of Heidrun’s work is to intertwine visual, analytic, and interactive methods for making sense of data. Heidrun published more than two hundred articles in top venues and journals. She co-authored the first German textbook on data visualization in 2000 and a textbook specifically on the visualization of time-oriented data in 2011. In 2014, Heidrun was elected as a Fellow of the Eurographics Association.
Heidrun Schumann is a professor at the University of Rostock, Germany, where she is heading the Chair of Computer Graphics at the Institute for Visual & Analytic Computing. She received doctoral degree (Dr.-Ing.) in 1981 and post-doctoral degree (Dr.-Ing. habil.) in 1989. Her research and teaching activities cover a variety of topics related to computer graphics, including information visualization, visual analytics, and rendering. She is interested in visualizing complex data in space and time, combining visualization and terrain rendering, and facilitating visual data analysis with progressive methods. A key focus of Heidrun’s work is to intertwine visual, analytic, and interactive methods for making sense of data. Heidrun published more than two hundred articles in top venues and journals. She co-authored the first German textbook on data visualization in 2000 and a textbook specifically on the visualization of time-oriented data in 2011. In 2014, Heidrun was elected as a Fellow of the Eurographics Association.
Recenzii
"What a joy! A book on Interactive Data Analysis was long overdue! The research community has produced a wealth of knowledge and techniques in the last 20 years that are not necessarily known to students, instructors and practitioners. This knowledge is for the most buried in hard-to-find papers and conference presentations. Tominski and Schumann, acknowledged scholars in the field, arranged brilliantly this whole set of principles, methods, and techniques in an intuitive and easy to read framework. I am looking forward to sharing this book with my colleagues and my students!" --Professor Enrico Bertini, NYU School of Engineering
"Christian Tominski and Heidrun Schumann give an excellent, encompassing introduction to concepts and techniques for the visual analysis of data. Their book stands out for its concise, integrated coverage of the main approaches for visual representation of and interaction with data, and automatic data analysis support. The work is very accessible and very well suited for classroom use. It is also an inspiring read for practitioners who wish to apply visual data analysis techniques to solve problems in business, engineering, science, and many other domains." --Professor Tobias Schreck, Institute of Computer Graphics and Knowledge Visualization, Graz University of Technology
"There is something sublime in the interplay between images and interaction. As a long-time student of visualization research, it seems to me that visualization for data analysis only comes into its own when interaction and visuals are seamlessly blended and supported with appropriate computational resources. Tominski and Schumann's Interactive Visual Data Analysis captures the essence of this rich synergy perfectly by showing how modern interactive visual analysis systems can be designed and built. For this reason, this book fills an important need for both students and practitioners looking to learn that most powerful yet elusive of data visualization concepts: visual analytics. I highly
recommend this book, and will be looking to adopt it for my own visual analytics classes." --Professor Niklas Elmqvist, College of Information Studies, University of Maryland
"The new book by C. Tominski and H. Schumann is a highlight: a concise, thorough and systematic introductory book on visualization with its links to data analysis and interaction. It is obviously based on the substantial experience of the authors in research and solving real-world problems. The tight connection between visual interfaces and visualization techniques is discussed in an impressive manner, including recent interaction styles and devices. Careful discussions of many visualization techniques enable the reader to critically analyze existing visualizations and to design appropriate and effective visualizations. The book is compact, and it provides orientation and guidance by a clear structure. It is also motivating, among others based on a careful selection of convincing figures. I will strongly recommend the book to the students of my bachelor course on visualization." -- Professor Bernhard Preim, Department of Simulation and Graphics, Otto-von-Guericke-University
Descriere
The book provides a comprehensive overview on information visualization and visual exploration. The top-down view on the problem illustrated with numerous examples based on real data and settings will help people from these domains to get a sound knowledge about key challenges, concepts and methodologies in this regard.
