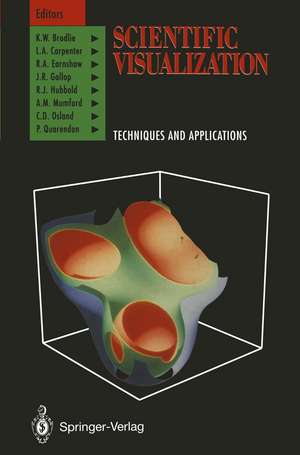
Scientific Visualization: Techniques and Applications
Editat de K. W. Brodlie, L. A. Carpenter, R.A. Earnshaw, J. R. Gallop, R.J. Hubbold, A.M. Mumford, C.D. Osland, P. Quarendonen Limba Engleză Paperback – 6 dec 2011
Preț: 333.40 lei
Preț vechi: 416.75 lei
-20% Nou
Puncte Express: 500
Preț estimativ în valută:
63.80€ • 66.37$ • 52.67£
63.80€ • 66.37$ • 52.67£
Carte tipărită la comandă
Livrare economică 15-29 aprilie
Preluare comenzi: 021 569.72.76
Specificații
ISBN-13: 9783642769443
ISBN-10: 3642769446
Pagini: 316
Ilustrații: XXV, 284 p.
Dimensiuni: 155 x 235 x 17 mm
Greutate: 0.45 kg
Ediția:Softcover reprint of the original 1st ed. 1992
Editura: Springer Berlin, Heidelberg
Colecția Springer
Locul publicării:Berlin, Heidelberg, Germany
ISBN-10: 3642769446
Pagini: 316
Ilustrații: XXV, 284 p.
Dimensiuni: 155 x 235 x 17 mm
Greutate: 0.45 kg
Ediția:Softcover reprint of the original 1st ed. 1992
Editura: Springer Berlin, Heidelberg
Colecția Springer
Locul publicării:Berlin, Heidelberg, Germany
Public țintă
ResearchCuprins
1 Introduction.- 1.1 What is Scientific Visualization?.- 1.2 History and Background.- 1.3 Current Activities in Scientific Visualization.- 1.4 Background to the AGOCG Workshop.- 1.5 Introduction to the Book.- 1.6 Recommendations of the Workshop.- 1.7 Key References.- 2 Framework.- 2.1 Introduction.- 2.2 Scope.- 2.3 High Level Models.- 2.4 Framework Model.- 2.5 Module Model.- 2.6 Functionality Aspects.- 2.7 Qualitative Aspects.- 2.8 Implementation.- 2.9 Key References.- 3 Visualization Techniques.- 3.1 Introduction.- 3.2 Elements of a Visualization Technique.- 3.3 Classification.- 3.4 Techniques for Point Data.- 3.5 Techniques for Scalar Entities.- 3.6 Techniques for Vector Entities.- 3.7 Techniques for Tensor Fields.- 3.8 Image Processing Techniques.- 3.9 Animation.- 3.10 Interaction Techniques.- 3.11 Perception of 3D.- 3.12 Conclusions and Future Trends.- 3.13 Key References.- 4 Data Facilities.- 4.1 Introduction.- 4.2 Data Sources.- 4.3 Data Classification.- 4.4 Management of Data.- 4.5 Data Transformation.- 4.6 Data Compression.- 4.7 Data Formats.- 4.8 Recommendations.- 4.9 Key References.- 5 Human-Computer Interface.- 5.1 Introduction.- 5.2 User Issues.- 5.3 System Issues.- 5.4 Conclusions and Recommendations.- 5.5 Key References.- 6 Applications.- 6.1 Introduction.- 6.2 Chapter Structure.- 6.3 Cartography.- 6.4 Study of Statistical Indicators.- 6.5 Remote Sensing.- 6.6 Analysis of Archaeological Data.- 6.7 Physical Chemistry and Drug Design.- 6.8 Biochemistry.- 6.9 Materials Research.- 6.10 Medical Science.- 6.11 Archaeological Reconstruction.- 6.12 Meteorology.- 6.13 Ice Stream Visualization.- 6.14 Oceanography.- 6.15 Oil Reservoir Engineering.- 6.16 Computational Fluid Dynamics.- 6.17 Dynamics of Systems.- 6.18 Program Visualization.- 6.19 Conclusions.- 6.20 KeyReferences.- 7 Products.- 7.1 Introduction.- 7.2 Visualization Software Categories.- 7.3 Examples of Software Products.- 7.4 Benchmarking and Validation.- 7.5 Future Trends.- 7.6 Conclusions.- 7.7 Key References.- 8 Conclusions.- 8.1 Summary- and where to get further information.- 8.2 Methodology and Reference Model.- 8.3 Techniques.- 8.4 Data Facilities.- 8.5 Human-Computer Interface.- 8.6 Applications.- 8.7 Products.- 8.8 Infrastructure Support.- 8.9 Other uses of Visualization Tools.- 8.10 Virtual Reality Systems.- 8.11 Importance of Scientific Visualization.- 8.12 References.- Appendices A Enabling Technologies.- A.1 Hardware.- A.2 Graphics software for ViSC.- A.3 User Interface Toolkits.- A.4 Database Systems.- A.5 ViSC Generic Data Formats.- A.6 Key References.- B Glossary.- B.1 Visualization Terms.- B.2 Abbreviations and Acronyms.- C Bibliography.
