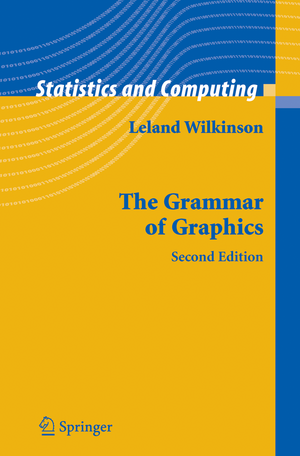
The Grammar of Graphics: Statistics and Computing
Autor Leland Wilkinson Contribuţii de D. Wills, D. Rope, A. Norton, R. Dubbsen Limba Engleză Hardback – 15 iul 2005
| Toate formatele și edițiile | Preț | Express |
|---|---|---|
| Paperback (1) | 959.32 lei 6-8 săpt. | |
| Springer – 17 sep 2011 | 959.32 lei 6-8 săpt. | |
| Hardback (1) | 1343.67 lei 6-8 săpt. | |
| Springer – 15 iul 2005 | 1343.67 lei 6-8 săpt. |
Din seria Statistics and Computing
- 20%
 Preț: 753.99 lei
 -
 Preț: 228.21 lei
 - 20%
 Preț: 505.20 lei
 -
 Preț: 438.82 lei
 -
 Preț: 386.81 lei
 - 20%
 Preț: 1059.77 lei
 -
 Preț: 426.73 lei
 - 20%
 Preț: 474.37 lei
 - 18%
 Preț: 1387.07 lei
 -
 Preț: 433.53 lei
 -
 Preț: 208.58 lei
 - 20%
 Preț: 1174.26 lei
 - 18%
 Preț: 959.32 lei
 - 15%
 Preț: 643.48 lei
 -
 Preț: 392.75 lei
 -
 Preț: 404.29 lei
 - 15%
 Preț: 640.06 lei
 - 20%
 Preț: 1454.73 lei
 -
 Preț: 377.18 lei
 - 23%
 Preț: 652.31 lei
 - 15%
 Preț: 710.42 lei
 - 15%
 Preț: 695.85 lei
 - 20%
 Preț: 1276.86 lei
 - 18%
 Preț: 1003.38 lei
 - 15%
 Preț: 703.85 lei
 -
 Preț: 384.70 lei
 - 15%
 Preț: 606.17 lei
 - 15%
 Preț: 646.94 lei
 - 15%
 Preț: 589.02 lei
 - 18%
 Preț: 1117.99 lei
 -
 Preț: 503.52 lei
 - 18%
 Preț: 735.38 lei
 - 15%
 Preț: 693.90 lei
Preț: 1343.67 lei
Preț vechi: 1638.63 lei
-18% Nou
Puncte Express: 2016
Preț estimativ în valută:
257.12€ • 274.94$ • 214.37£
257.12€ • 274.94$ • 214.37£
Carte tipărită la comandă
Livrare economică 18 aprilie-02 mai
Preluare comenzi: 021 569.72.76
Specificații
ISBN-13: 9780387245447
ISBN-10: 0387245448
Pagini: 691
Ilustrații: XVIII, 691 p.
Dimensiuni: 155 x 235 x 43 mm
Greutate: 1.09 kg
Ediția:2nd ed. 2005
Editura: Springer
Colecția Springer
Seria Statistics and Computing
Locul publicării:New York, NY, United States
ISBN-10: 0387245448
Pagini: 691
Ilustrații: XVIII, 691 p.
Dimensiuni: 155 x 235 x 43 mm
Greutate: 1.09 kg
Ediția:2nd ed. 2005
Editura: Springer
Colecția Springer
Seria Statistics and Computing
Locul publicării:New York, NY, United States
Public țintă
Professional/practitionerCuprins
Syntax.- How To Make a Pie.- Data.- Variables.- Algebra.- Scales.- Statistics.- Geometry.- Coordinates.- Aesthetics.- Facets.- Guides.- Semantics.- Space.- Time.- Uncertainty.- Analysis.- Control.- Automation.- Reader.- Coda.
Recenzii
From the reviews of the second edition:
"This fascinating book deconstructs the process of producing graphics and in doing so raises many fascinating questions on the nature and representation of information...This second edition is almost twice the size of the original, with six new chapters and substantial revisions." Short Book Reviews of the International Statistical Institute, December 2005
"When the first edidtion of this book appeared in 2000 it was much praised. I called it a tour de force of the highest order. (Wainer, 2001), Edward Wegman (2000) argued that it was destined to become a classic. Now, six years later this very fine book has been much improved." Howard Wainer for Psychometrika
"...The second edition is an impressive expansion beyond a quite remarkable first edition. The text remains dense and even more encyclopedic, but it is a pleasure to read, whether a novice or an expert in graphics...this book is a bargain...The second edition is a must-have volume for anyone interested in graphics." Thomas E. Bradstreet for the Journal of the American Statistical Association, December 2006
"I find myself still thinking about the book and its ideas, several weeks after I finished reading it. I love that kind of book." Mark Bailey for Techometrics, Vol. 49, No. 1, February 2007
"Warts and all, The Grammar of Graphics is a richly rewarding work, an outstanding achievement by one of the leaders of statistical graphics. Seek it out." Nicholas J. Cox for the Journal of Statistical Software, January 2007
"The second edition is a quite fascinating book as well, and it comes with many color graphics. Anyone working in this field can see how many hours the author (plus coworkers) has spent on such a volume. … Demands for good graphics are high and this book will help to wetten the appetite to create future computer packages that willmeet this demand. An occasional reader will get insights into a modern world of computing … ." (Wolfgang Polasek, Statistical Papers, Vol. 48, 2007)
Textul de pe ultima copertă
This book was written for statisticians, computer scientists, geographers, researchers, and others interested in visualizing data. It presents a unique foundation for producing almost every quantitative graphic found in scientific journals, newspapers, statistical packages, and data visualization systems. While the tangible results of this work have been several visualization software libraries, this book focuses on the deep structures involved in producing quantitative graphics from data. What are the rules that underlie the production of pie charts, bar charts, scatterplots, function plots, maps, mosaics, and radar charts? Those less interested in the theoretical and mathematical foundations can still get a sense of the richness and structure of the system by examining the numerous and often unique color graphics it can produce. The second edition is almost twice the size of the original, with six new chapters and substantial revision. Much of the added material makes this book suitable for survey courses in visualization and statistical graphics.
From reviews of the first edition:
"Destined to become a landmark in statistical graphics, this book provides a formal description of graphics, particularly static graphics, playing much the same role for graphics as probability theory played for statistics."
Journal of the American Statistical Association
"Wilkinson’s careful scholarship shows around every corner. This is a tour de force of the highest order."
Psychometrika
"All geography and map libraries should add this book to their collections; the serious scholar of quantitative data graphics will place this book on the same shelf with those by Edward Tufte, and volumes by Cleveland, Bertin, Monmonier, MacEachren, among others, and continue the unending task of proselytizing for the best in statistical data presentation by example and through scholarship like that of Leland Wilkinson."
Cartographic Perspectives
"In summary, this is certainly a remarkable book and a new ambitious step for the development and application of statistical graphics."
Computational Statistics and Data Analysis
About the author:
Leland Wilkinson is Senior VP, SPSS Inc. and Adjunct Professor of Statistics at Northwestern University. He is also affiliated with the Computer Science department at The University of Illinois at Chicago. He wrote the SYSTAT statistical package and founded SYSTAT Inc. in 1984. Wilkinson joined SPSS in a 1994 acquisition and now works on research and development of visual analytics and statistics. He is a Fellow of the ASA. In addition to journal articles and the original SYSTAT computer program and manuals, Wilkinson is the author (with Grant Blank and Chris Gruber) of Desktop Data Analysis with SYSTAT.
Caracteristici
Presents a unique foundation for producing almost every quantitative graphic found in scientific journals, newspapers, statistical packages, and data visualization systems
