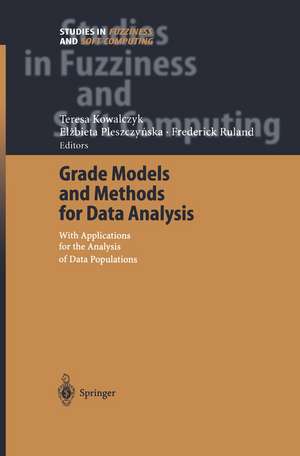
Grade Models and Methods for Data Analysis: With Applications for the Analysis of Data Populations: Studies in Fuzziness and Soft Computing, cartea 151
Editat de Teresa Kowalczyk, Elzbieta Pleszczynska, Frederick Rulanden Limba Engleză Paperback – 20 iul 2012
| Toate formatele și edițiile | Preț | Express |
|---|---|---|
| Paperback (1) | 1216.88 lei 43-57 zile | |
| Springer Berlin, Heidelberg – 20 iul 2012 | 1216.88 lei 43-57 zile | |
| Hardback (1) | 1211.76 lei 43-57 zile | |
| Springer Berlin, Heidelberg – 16 apr 2004 | 1211.76 lei 43-57 zile |
Din seria Studies in Fuzziness and Soft Computing
- 20%
 Preț: 992.48 lei
 - 20%
 Preț: 648.25 lei
 - 20%
 Preț: 284.42 lei
 - 20%
 Preț: 872.96 lei
 - 20%
 Preț: 914.87 lei
 - 20%
 Preț: 1033.25 lei
 - 20%
 Preț: 975.69 lei
 - 20%
 Preț: 644.82 lei
 - 20%
 Preț: 984.96 lei
 - 18%
 Preț: 938.04 lei
 - 20%
 Preț: 327.66 lei
 - 20%
 Preț: 330.59 lei
 - 20%
 Preț: 980.73 lei
 -
 Preț: 385.06 lei
 - 20%
 Preț: 636.88 lei
 - 20%
 Preț: 969.37 lei
 - 18%
 Preț: 942.39 lei
 - 20%
 Preț: 979.59 lei
 - 20%
 Preț: 982.49 lei
 - 15%
 Preț: 635.55 lei
 - 20%
 Preț: 640.59 lei
 - 20%
 Preț: 981.06 lei
 - 15%
 Preț: 630.23 lei
 - 20%
 Preț: 992.70 lei
 - 20%
 Preț: 975.87 lei
 -
 Preț: 382.22 lei
 - 18%
 Preț: 1202.76 lei
 - 20%
 Preț: 646.63 lei
 - 18%
 Preț: 935.55 lei
 - 18%
 Preț: 932.61 lei
Preț: 1216.88 lei
Preț vechi: 1484.00 lei
-18% Nou
Puncte Express: 1825
Preț estimativ în valută:
232.96€ • 239.58$ • 193.26£
232.96€ • 239.58$ • 193.26£
Carte tipărită la comandă
Livrare economică 17 februarie-03 martie
Preluare comenzi: 021 569.72.76
Specificații
ISBN-13: 9783642535611
ISBN-10: 3642535615
Pagini: 492
Ilustrații: X, 477 p.
Dimensiuni: 155 x 235 x 26 mm
Greutate: 0.68 kg
Ediția:Softcover reprint of the original 1st ed. 2004
Editura: Springer Berlin, Heidelberg
Colecția Springer
Seria Studies in Fuzziness and Soft Computing
Locul publicării:Berlin, Heidelberg, Germany
Public țintă
ResearchCuprins
1 Grade Data Analysis — A First Look.- 1.1 “Questions” from clients.- 1.2 About “Grade Models and Methods for Data Analysis”.- 1.3 Addressing the practitioner.- 1.4 Addressing the theorist.- 1.5 Regarding the analysis of data populations.- 1.6 Overview of Grade Data Analysis algorithms.- 1.7 Returning to the clients from the first page.- 1.8 Conclusion — Chapter 1.- 2 The Grade Approach.- 2.1 Introduction.- 2.2 Part 1: Quick start to the understanding of grade concepts.- 2.3 Steps to making a concentration curve.- 2.4 Quick Start summary.- 2.5 Preview of Part 2, and suggestions before your eventual study of the multivariate material.- 2.6 Part 2: Understanding concentration curves.- 2.7 Chapter Summary.- 3 Univariate Lilliputian Model I.- 3.1 Introduction.- 3.2 Lilliputian variables and their basic parameters.- 3.3 The main equivalence relation which creates the Univariate Lilliputian Model.- 3.4 Grade parameters.- 3.5 Appendix.- 4 Univariate Lilliputian Model II.- 4.1 Introduction.- 4.2 Lorenz Curve and Gini Index.- 4.3 Order oriented concentration curves.- 4.4 Dual concentration curve.- 4.5 Appendix.- 5 Asymmetry and the inverse concentration set.- 5.1 Introduction.- 5.2 Concentration curves with a common value of the concentration index.- 5.3 Links between asymmetry and opposite orderings.- 5.4 Asymmetry in the Univariate Lilliputian Model.- 5.5 Relative asymmetry.- 5.6 Appendix.- 6 Discretization and regularity.- 6.1 Introduction.- 6.2 Discretization framework.- 6.3 Optimal discretization for a given number of categories.- 6.4 Ideally regular concentration curves.- 6.5 On the determination of the number of categories.- 6.6 A parametric family of ideally regular Lilliputian curves.- 6.7 Appendix.- 7 Preliminary concepts of bivariate dependence.- 7.1Introduction.- 7.2 Contingency tables with m rows and k columns.- 7.3 Quadrant dependence.- 7.4 Matrices of ar’s for pairs of profilesTotal positivity of order two.- 7.5 The regression function.- 7.6 The monotone dependence function and the Gini Index.- 7.7 Appendix — Bibliographical remarks.- 8 Dependence Lilliputian Model.- 8.1 Introduction.- 8.2 Grade bivariate distributions and overrepresentation maps for probability tables.- 8.4 Spearman’s rho and Kendall’s tau expressed by volumes and masses in the unit cube.- 8.5 Grade regression functions and related measures.- 8.6 On permuting rows and columns of m × k probability tables.- 8.7 The hinged sequences of rows and columns.- 8.8 Appendix: Bibliographical remarks.- 9 Grade Correspondence Analysis and outlier detection.- 9.1 Introduction.- 9.2 Algorithms of GCA.- 9.3 Algorithm for Smooth Grade Correspondence Analysis (SGCA).- 9.4 Examples of GCA and SGCA results.- 9.5 Detection of rows and columns outlying the main trend.- 9.6 Appendix — Bibliographical remarks.- 10 Cluster analysis based on GCA.- 10.1 Introduction.- 10.2 Single and double grade clustering.- 10.3 Optimal grade clustering.- 10.4 Cluster analysis in the detection of mixtures.- 10.5 Cluster analysis and the detection of an imprecisely defined trend.- 10.6 On GCCA application to various data sets.- 10.7 Appendix.- 11 Regularity and the number of clusters.- 11.1 Introduction.- 11.2 Generalization of the parabola family from the 𝕌𝕃𝕄.- 11.3 The ideal regularity of two-way data tables.- 11.4 Regularity and cluster detection.- 11.5 Cluster detection in finite data tables.- 11.6 Appendix — Bibliographical remarks.- 12 Grade approach to the analysis of finite data matrices.- 12.1 Introduction.- 12.2 Insight Examples.- 12.3Applicability of GCA.- 12.4 A revisit of the univariate data.- 12.5 Finite multivariate datasets and related inequality measures.- 12.6 Transformations of variables.- 12.7 Detection of outliers and decomposition of a dataset.- 13 Inequality measures for multivariate distributions.- 13.1 Introduction.- 13.2 Inequality measures for multivariate distributions with finite sets of records.- 13.3 Inequality measures for multivariate distributions with nonfinite sets of records.- 13.4 Inequality measures for continuous bivariate distributions.- 13.5 Inequality measures for grade multinormal distributions.- 13.6 Inequality measures for the Moran distributions.- 13.7 Appendix — link between grade similarity and dissimilarity of two regularly dependent random variables.- 14 Case studies with multivariate data.- 14.1 Introduction.- 14.2 Case Study 1 — Main Trend of Questionnaire Data.- 14.3 Case Study 1 — Decomposition of the dataset into regular subpopulations.- 14.4 Case Study 2 — Analysis of Engineering Data (Strength of Concrete).- 14.5 Case Study 2 — Decomposition of concrete mixtures into FITMT and OUT-MT.- 14.6 Final remarks for the two case studies.- 14.7 Appendix.- 15 The GradeStat program.- 15.1 Introduction.- 15.2 Main implemented features.- References.
Textul de pe ultima copertă
This book provides a new grade methodology for intelligent data analysis. It introduces a specific infrastructure of concepts needed to describe data analysis models and methods. This monograph is the only book presently available covering both the theory and application of grade data analysis and therefore aiming both at researchers, students, as well as applied practitioners. The text is richly illustrated through examples and case studies and includes a short introduction to software implementing grade methods, which can be downloaded from the editors.
Caracteristici
Provides a new grade methodology for intelligent data analysis The only book presently available covering both the theory and application of grade data analysis Includes supplementary material: sn.pub/extras


