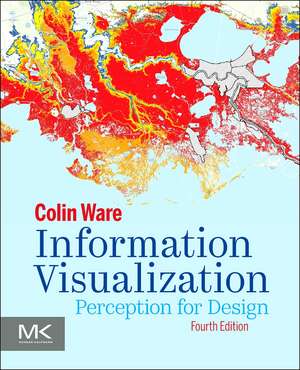
Information Visualization: Perception for Design: Interactive Technologies
Autor Colin Wareen Limba Engleză Paperback – mai 2020
New changes to the book make it easier to apply perceptual lessons to design decisions. In addition, the book offers practical guidelines that can be applied by anyone, including interaction designers and graphic designers of all kinds.
- Includes the latest research findings in visualization and perception
- Provides a new chapter on designing for perception to help bridge the gap between specific perception-based guidelines and common design decisions
- Presents over 400 informative, full color illustrations that are key to an understanding of the subject
Din seria Interactive Technologies
- 20%
 Preț: 310.79 lei
 - 34%
 Preț: 244.47 lei
 - 20%
 Preț: 291.57 lei
 - 38%
 Preț: 348.00 lei
 - 31%
 Preț: 306.16 lei
 - 20%
 Preț: 496.28 lei
 - 32%
 Preț: 229.80 lei
 - 32%
 Preț: 228.02 lei
 - 31%
 Preț: 275.36 lei
 - 31%
 Preț: 359.88 lei
 - 20%
 Preț: 594.99 lei
 - 20%
 Preț: 730.82 lei
 - 8%
 Preț: 227.94 lei
 - 21%
 Preț: 297.76 lei
 - 27%
 Preț: 412.82 lei
 - 20%
 Preț: 410.91 lei
 - 27%
 Preț: 258.72 lei
 - 20%
 Preț: 346.23 lei
 - 28%
 Preț: 210.27 lei
Preț: 355.53 lei
Preț vechi: 542.37 lei
-34% Nou
Puncte Express: 533
Preț estimativ în valută:
68.05€ • 73.94$ • 57.20£
68.05€ • 73.94$ • 57.20£
Carte disponibilă
Livrare economică 24 martie-07 aprilie
Livrare express 15-21 martie pentru 124.92 lei
Preluare comenzi: 021 569.72.76
Specificații
ISBN-13: 9780128128756
ISBN-10: 0128128755
Pagini: 560
Dimensiuni: 191 x 235 x 20 mm
Greutate: 0.87 kg
Ediția:4
Editura: ELSEVIER SCIENCE
Seria Interactive Technologies
ISBN-10: 0128128755
Pagini: 560
Dimensiuni: 191 x 235 x 20 mm
Greutate: 0.87 kg
Ediția:4
Editura: ELSEVIER SCIENCE
Seria Interactive Technologies
Public țintă
upper level undergraduate and graduate students taking data visualization courses in computer science, computer engineering, and physics departments; professionals in user interface/user interaction designer; computer graphics, research scientists and engineers; data miners; and managers faced with information-intensive challengesCuprins
1. Foundations for an Applied Science of Data Visualization
2. The Environment, Optics, Resolution, and the Display
3. Lightness, Brightness, Contrast, and Constancy
4. Color
5. Visual Salience and Finding Information
6. Static and Moving Patterns
7. Space Perception
8. Visual Objects and Data Objects
9. Images, Narrative, and Gestures for Explanation
10. Interacting with Visualizations
11. Visual Thinking Processes
12. Designing for Perception (new)
Visual Thinking Algorithms
Visual Queries
Pathfinding on a Map or Diagram
Reasoning with a Hybrid of a Visual Display and Mental Imagery
Design Sketching
Brushing
Small Pattern Comparisons in a Large Information Space
Degree-of-Relevance Highlighting
Generalized Fisheye Views
Multidimensional Dynamic Queries with Scatter Plot
Visual Monitoring Strategies
APPENDIX
A. Changing Primaries
B. CIE Color Measurement System
Techniques and Systems
C. Guidelines


