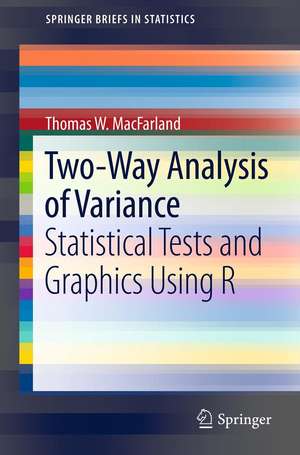
Two-Way Analysis of Variance: Statistical Tests and Graphics Using R: SpringerBriefs in Statistics
Autor Thomas W. MacFarlanden Limba Engleză Paperback – 9 dec 2011
Din seria SpringerBriefs in Statistics
-
 Preț: 378.34 lei
 - 15%
 Preț: 459.93 lei
 - 17%
 Preț: 359.75 lei
 -
 Preț: 411.54 lei
 -
 Preț: 445.88 lei
 -
 Preț: 445.33 lei
 -
 Preț: 378.71 lei
 -
 Preț: 375.23 lei
 -
 Preț: 378.71 lei
 -
 Preț: 350.50 lei
 -
 Preț: 378.54 lei
 -
 Preț: 378.71 lei
 - 15%
 Preț: 461.73 lei
 -
 Preț: 352.28 lei
 -
 Preț: 378.54 lei
 -
 Preț: 377.73 lei
 - 5%
 Preț: 360.70 lei
 -
 Preț: 351.42 lei
 -
 Preț: 378.92 lei
 -
 Preț: 375.07 lei
 -
 Preț: 342.74 lei
 -
 Preț: 444.35 lei
 -
 Preț: 414.42 lei
 - 15%
 Preț: 462.70 lei
 -
 Preț: 378.54 lei
 -
 Preț: 378.12 lei
 -
 Preț: 271.46 lei
 -
 Preț: 347.71 lei
 -
 Preț: 377.73 lei
 -
 Preț: 270.74 lei
 -
 Preț: 378.54 lei
 - 5%
 Preț: 327.04 lei
 -
 Preț: 377.18 lei
 -
 Preț: 273.40 lei
 -
 Preț: 377.18 lei
 -
 Preț: 379.30 lei
 -
 Preț: 376.59 lei
 -
 Preț: 379.68 lei
 -
 Preț: 272.04 lei
 -
 Preț: 378.54 lei
 -
 Preț: 379.09 lei
 -
 Preț: 446.26 lei
 -
 Preț: 375.84 lei
 -
 Preț: 344.14 lei
 -
 Preț: 348.72 lei
 -
 Preț: 377.95 lei
 -
 Preț: 269.71 lei
 - 5%
 Preț: 361.06 lei
 -
 Preț: 375.84 lei
 -
 Preț: 442.62 lei
Preț: 446.47 lei
Nou
Puncte Express: 670
Preț estimativ în valută:
85.43€ • 89.20$ • 70.55£
85.43€ • 89.20$ • 70.55£
Carte tipărită la comandă
Livrare economică 15-29 aprilie
Preluare comenzi: 021 569.72.76
Specificații
ISBN-13: 9781461421337
ISBN-10: 1461421330
Pagini: 135
Ilustrații: VII, 150 p. 3 illus., 2 illus. in color.
Dimensiuni: 155 x 235 x 15 mm
Greutate: 0.23 kg
Ediția:2012
Editura: Springer
Colecția Springer
Seria SpringerBriefs in Statistics
Locul publicării:New York, NY, United States
ISBN-10: 1461421330
Pagini: 135
Ilustrații: VII, 150 p. 3 illus., 2 illus. in color.
Dimensiuni: 155 x 235 x 15 mm
Greutate: 0.23 kg
Ediția:2012
Editura: Springer
Colecția Springer
Seria SpringerBriefs in Statistics
Locul publicării:New York, NY, United States
Public țintă
ResearchCuprins
1. Introduction.2. Data Import or Data Entry3. Data Organization4. Display the Code Book5. Conduct a Visual Data Check6. Descriptive Analysis of the Data.
Recenzii
“This book provides a detailed description of theuse of R code with examples for statistical tests and graphics in two-wayanalysis of variance in four chapters. … It is a great softcover book forself-learning and self-training at a modest price.” (Subir Ghosh, Technometrics, Vol. 56 (4), November,2014)
Notă biografică
Thomas W. MacFarland
Senior Research Associate and Associate Professor
Nova Southeastern University Office of Institutional Effectiveness
Fort Lauderdale, FL 33314 tommac@nova.edu
Senior Research Associate and Associate Professor
Nova Southeastern University Office of Institutional Effectiveness
Fort Lauderdale, FL 33314 tommac@nova.edu
Textul de pe ultima copertă
In statistics, analysis of variance (ANOVA) is a collection of statistical models used to distinguish between an observed variance in a particular variable and its component parts. In its simplest form, ANOVA provides a statistical test of whether or not the means of several groups are all equal, and therefore generalizes a test between these groups. One test often used by statisticians and researchers in their work is the Two-Way ANOVA, which determines the differences--and possible interactions--when variables are presented from the perspective of two or more categories. When a Two-Way ANOVA is implemented, it enables one to compare and contrast variables resulting from independent or joint actions. This brief provides guidance on how R can be used to facilitate Two-Way ANOVA for data analysis and graphical presentation. Along with instruction on the use of R and R syntax associated with Two-Way ANOVA, this brief will also reinforce the use of descriptive statistics and graphical figures to complement outcomes from parametric Two-Way ANOVA.
Caracteristici
Includes supplementary material: sn.pub/extras
